
Every experienced trader knows that when the macroeconomic tides shift individual asset fundamentals practically vanish. What we are witnessing in this final week of june 2026 is a brutal masterclass in global asset correlation. It is not just your favorite altcoin or a random tech stock taking a hit but instead we are looking at a synchronous flush that has pushed market psychology down to absolute panic levels. If you want to understand why everything is bleeding at the exact same moment you need to look at the invisible strings of global cash distribution.
Red Across the Board is an Understatement
Normally a downturn in high risk equities sends capital rushing into safe havens like precious metals or decentralized stores of value. Yet the current market dynamic is breaking all conventional rules because shares, bitcoin, gold, silver, and energy assets are collapsing together in a unified liquidation window. This rare phenomenon points toward a massive structural squeeze where market participants are being forced to dump their liquid holdings to stay afloat.
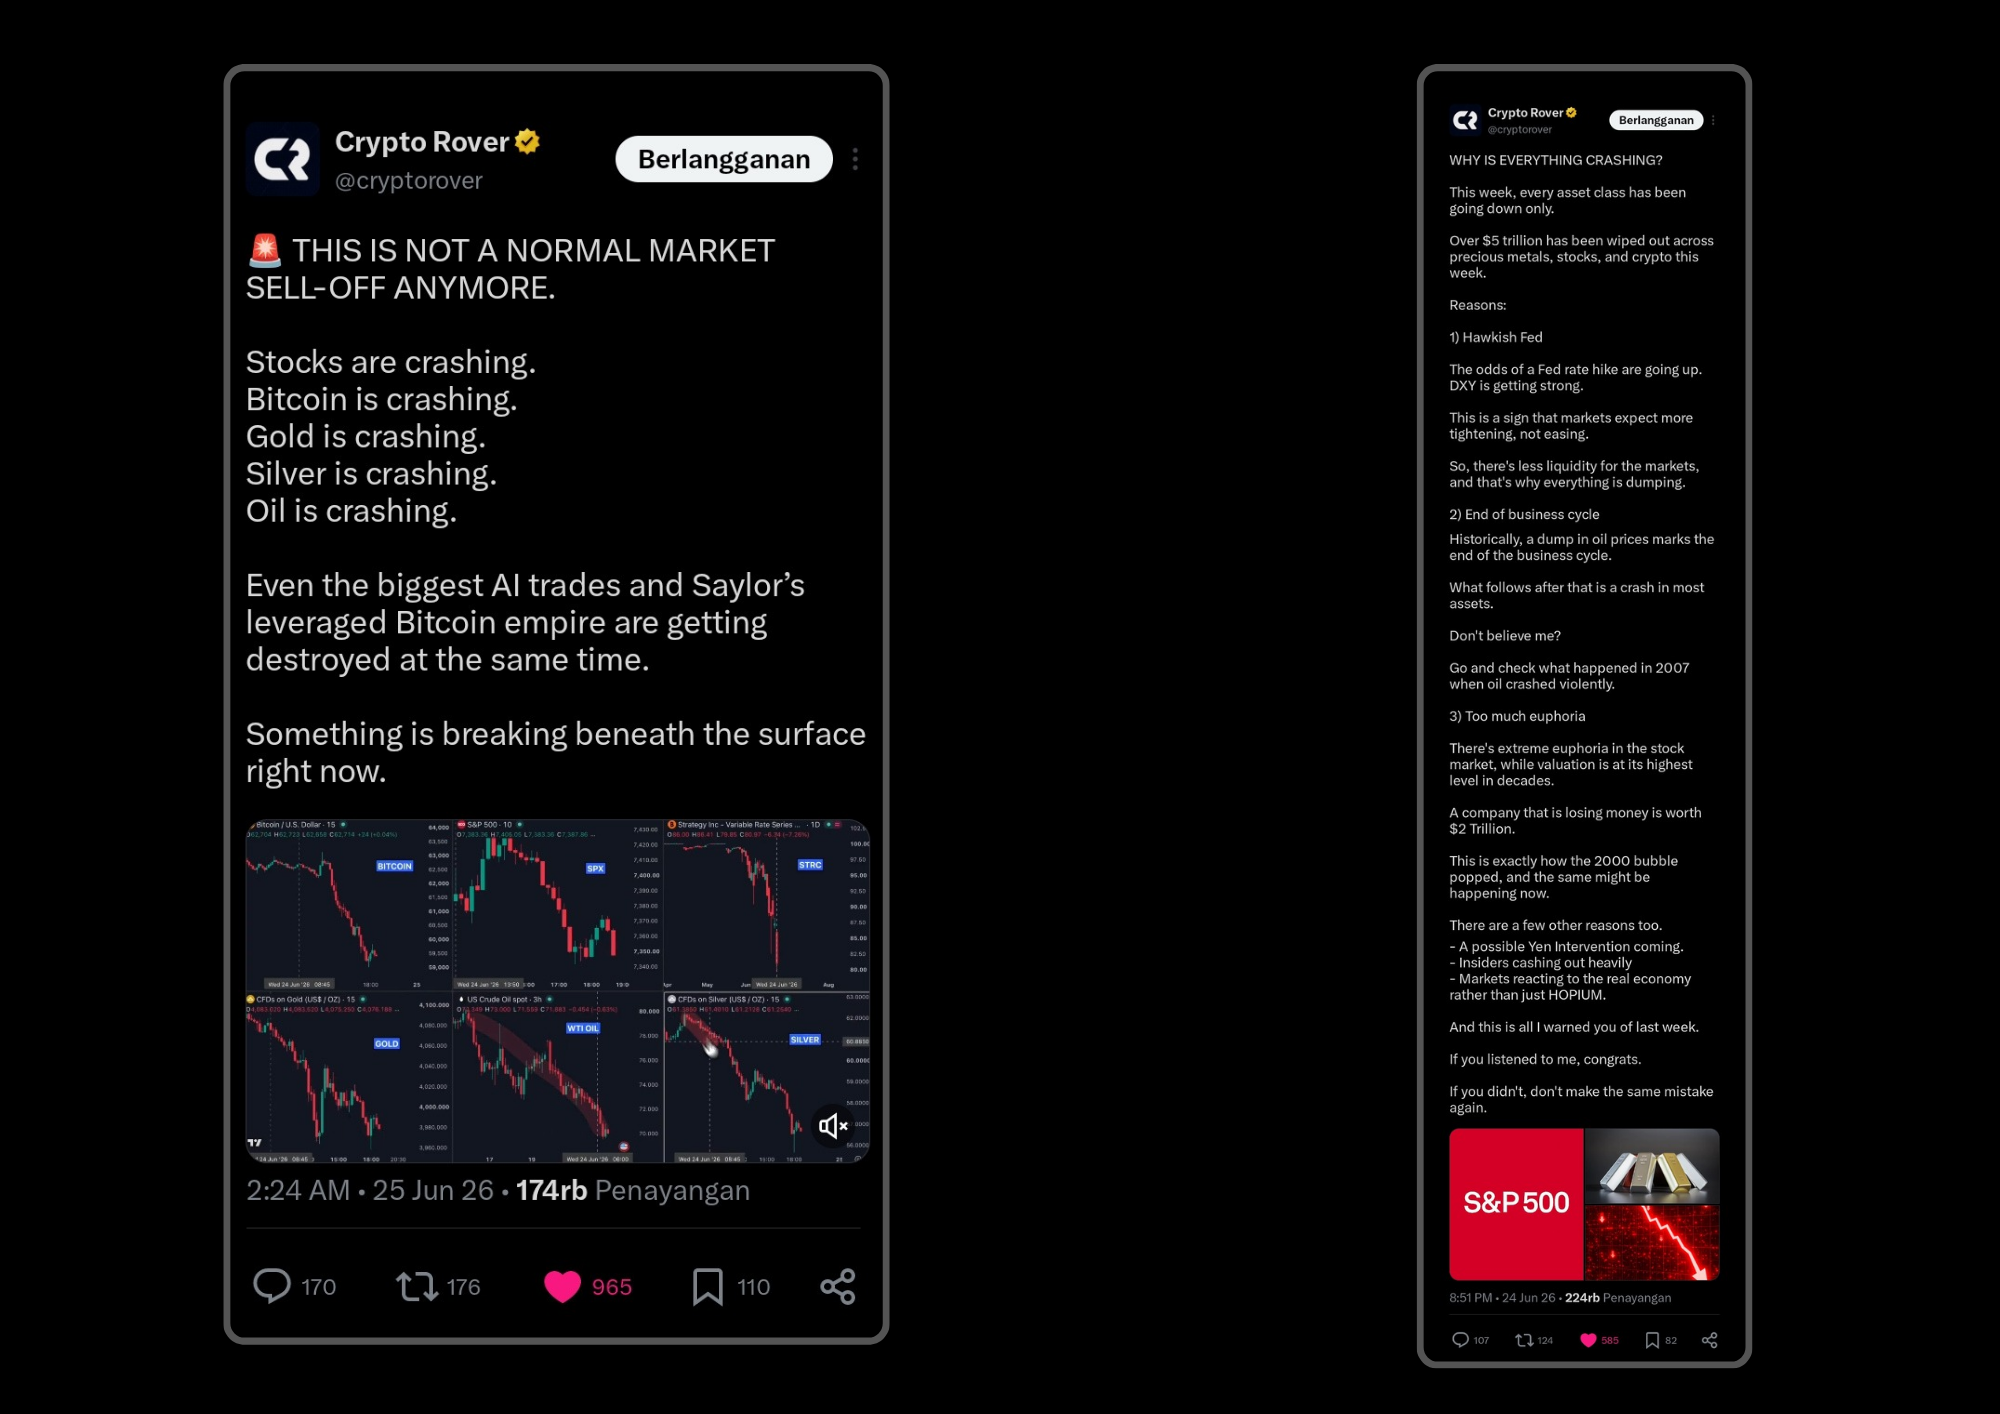
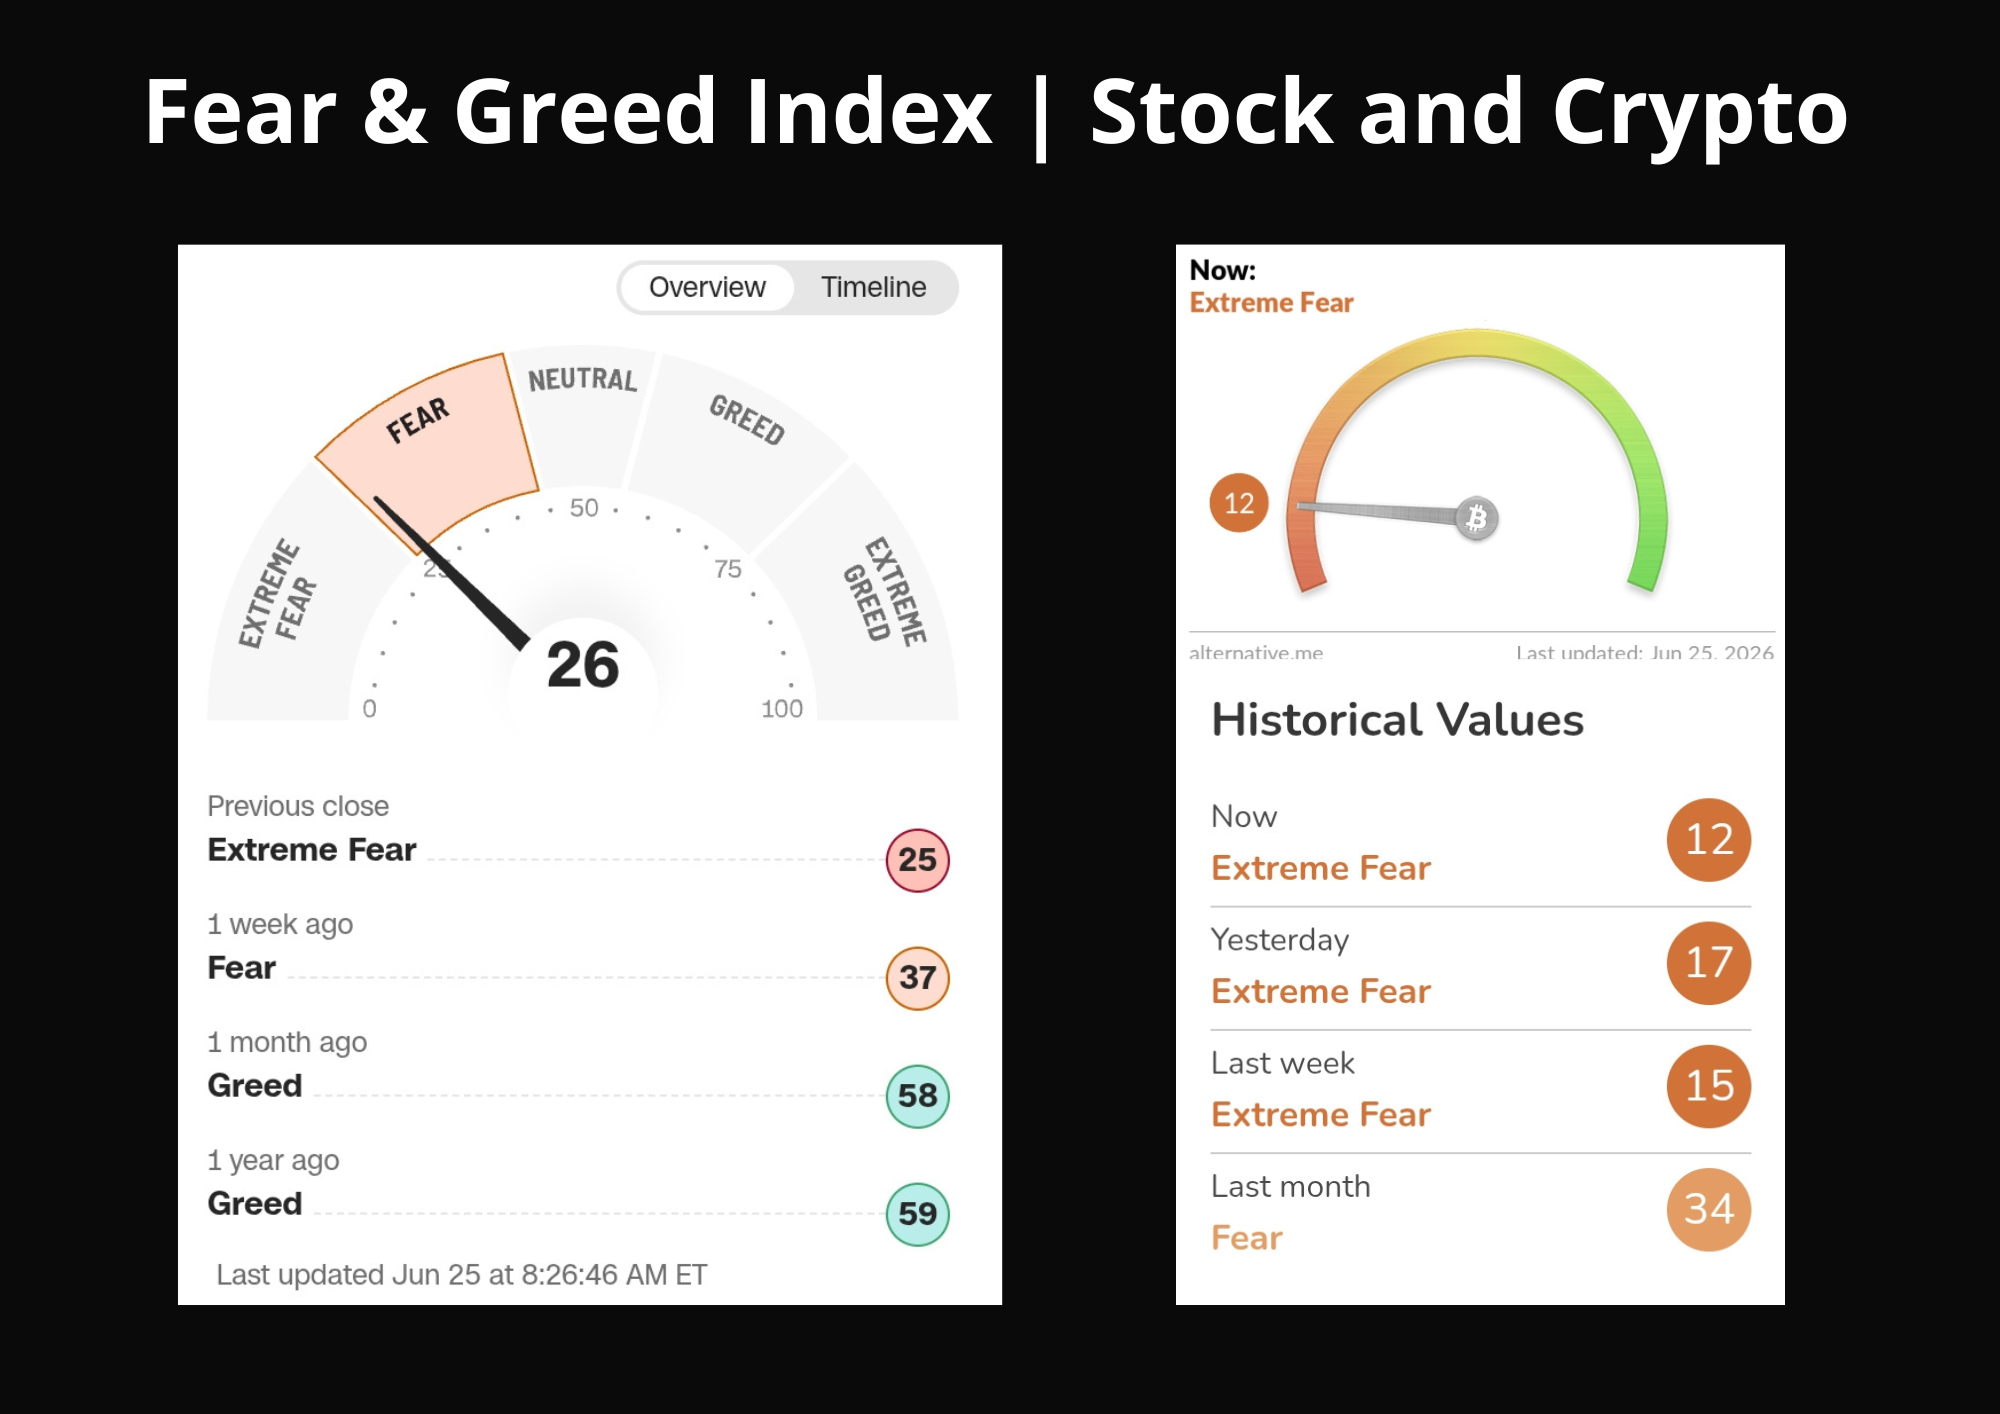
The sheer scale of this synchronized drop has sparked heavy debates across social trading platforms. Prominent analysts are pointing out that this is not a standard sector rotation but rather a broad exit from risk itself. Retail traders are completely paralyzed by fear right now. This structural panic is deeply backed by sentiment data where the traditional equity fear and greed index has plunged to a worrisome 26 while the crypto equivalent is screaming extreme fear at a mere 12. These figures highlight an absolute washout of retail confidence.
Mapping the Collateral Damage Across S&P 500 Forex and Crypto
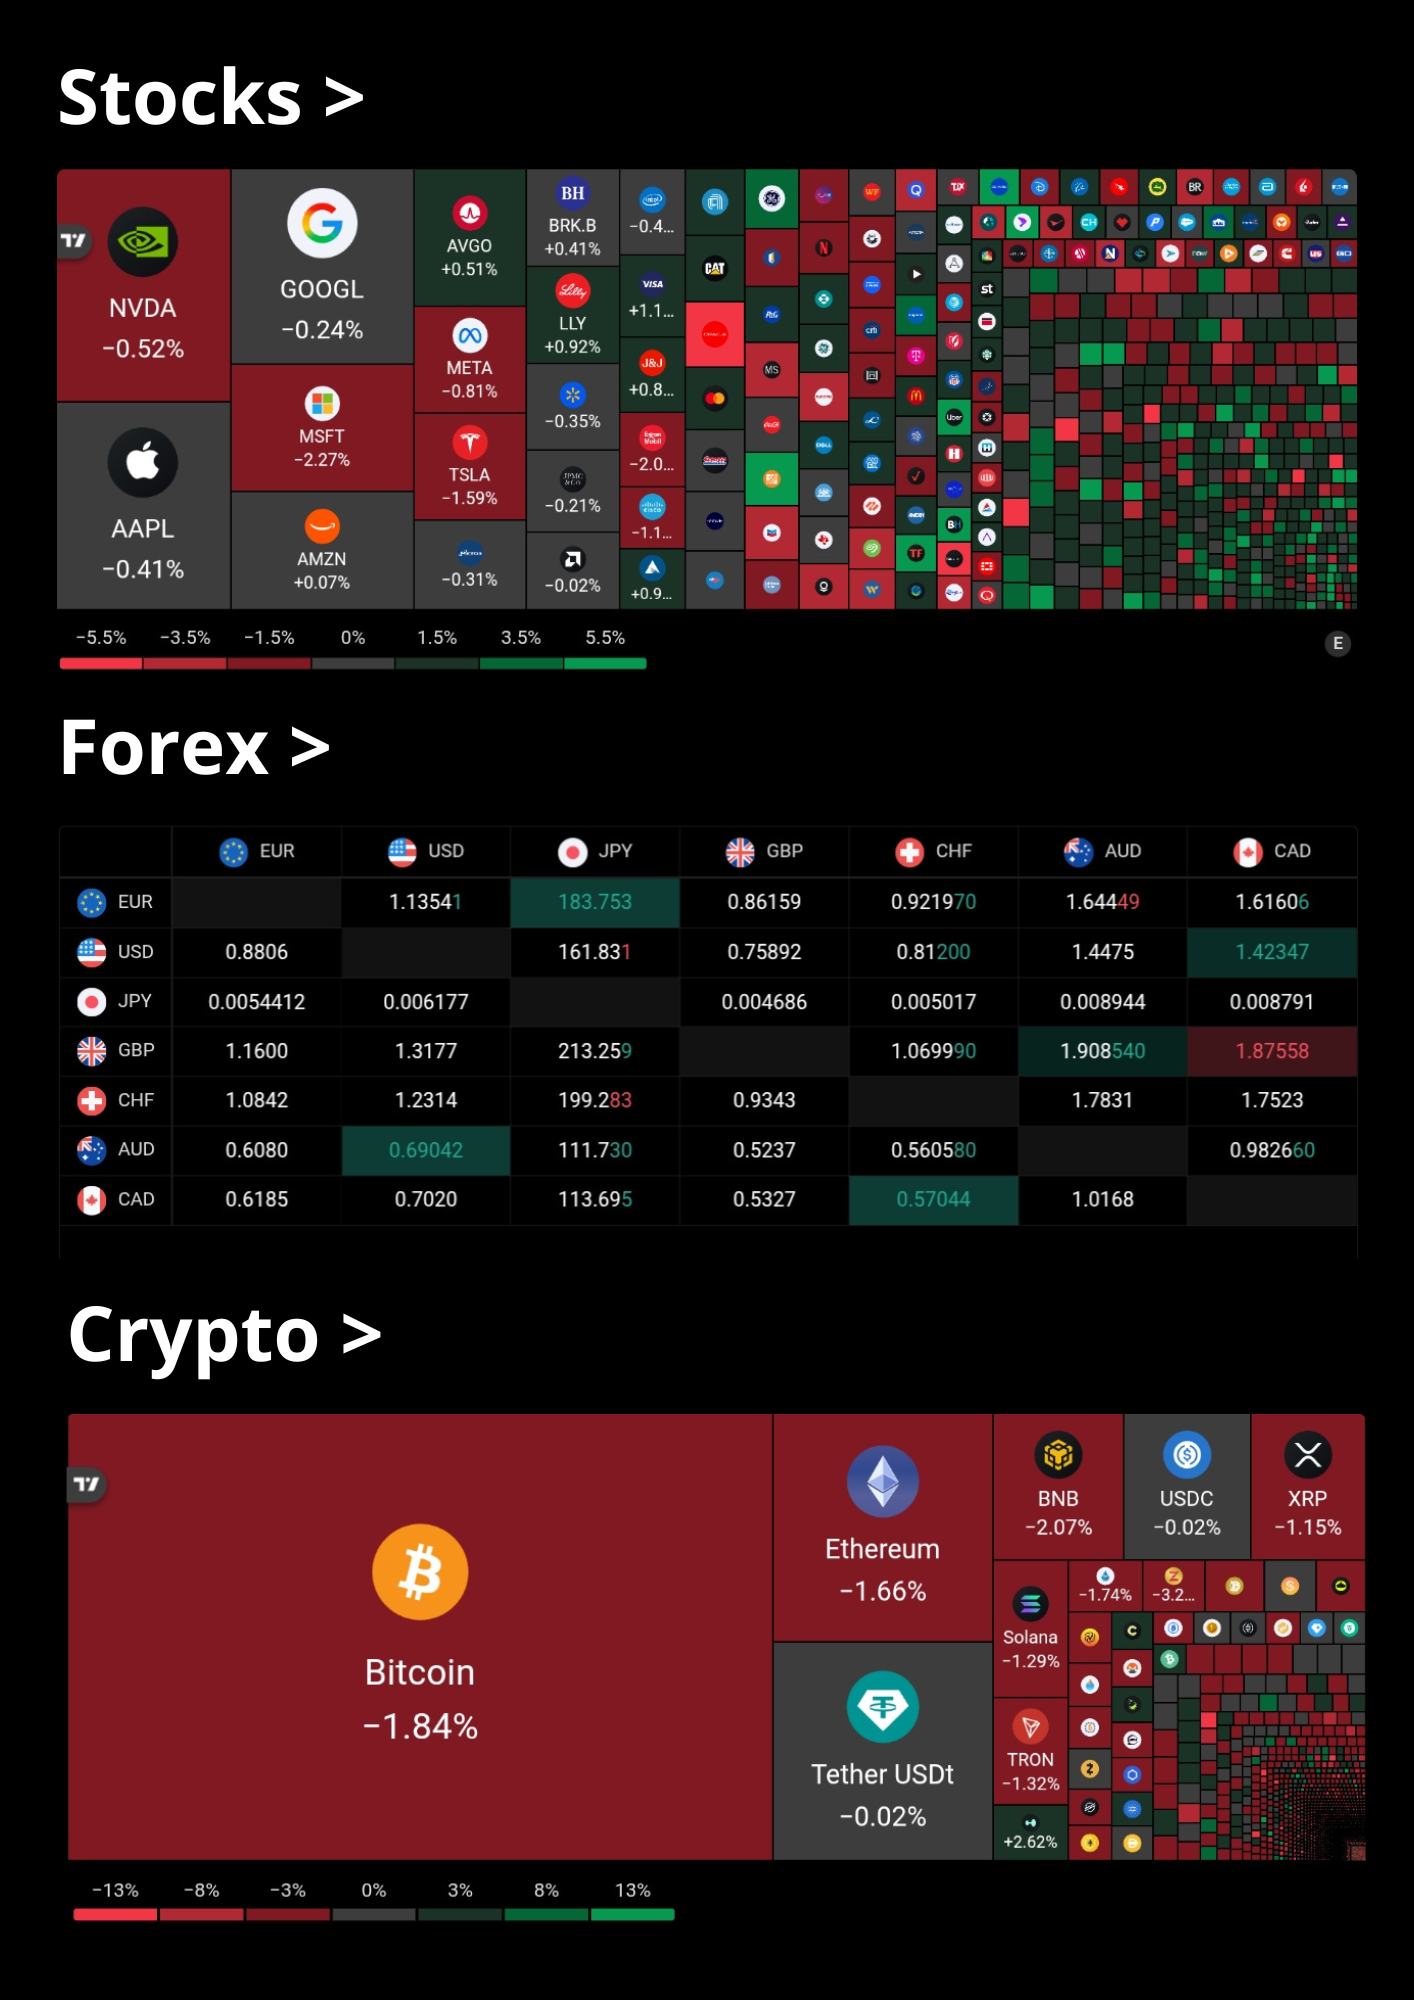
A quick glance at the market heatmap reveals a sea of crimson that leaves no sector untouched. On Wall Street the massive artificial intelligence rally that kept the markets afloat for months is officially pausing. Tech heavyweights including Microsoft, Apple, and Nvidia are seeing heavy institutional profit taking as funds rotate into raw cash.
Meanwhile the foreign exchange domain is experiencing extreme turbulence due to the unstoppable surge of the US Dollar. The USD/JPY pair is hovering dangerously in the 161.00 to 163.00 territory which is fueling immense market speculation about an imminent direct intervention by Japanese financial authorities. Naturally this heavy macro weight has crushed the digital asset space where Bitcoin and Ethereum are consistently leading a daily downward grind that leaves mid cap altcoins completely devastated.
Deciphering the Technical Damage on Essential Macro Charts
To wrap our heads around this chaotic market structure we have to analyze the charts that dictate global order flow namely the US Dollar Index along with its direct victims.
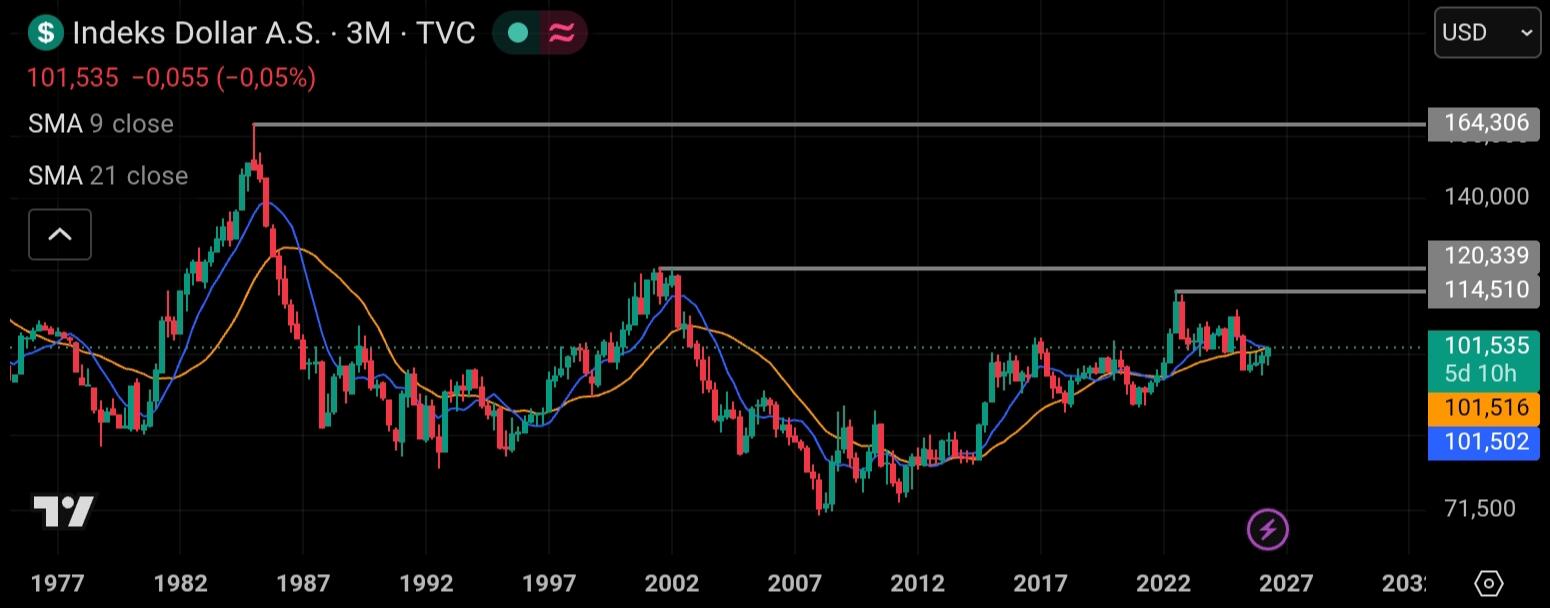
1. US Dollar Index
Looking at the macro 3 month chart the US Dollar Index is puting on an incredibly aggressive bullish expansion toward the 101,5 zone. This massive rally in the dollar acts like a liquidity vacuum for the entire financial world because when cash becomes this expensive and highly demanded asset valuations across the globe must adjust downward.
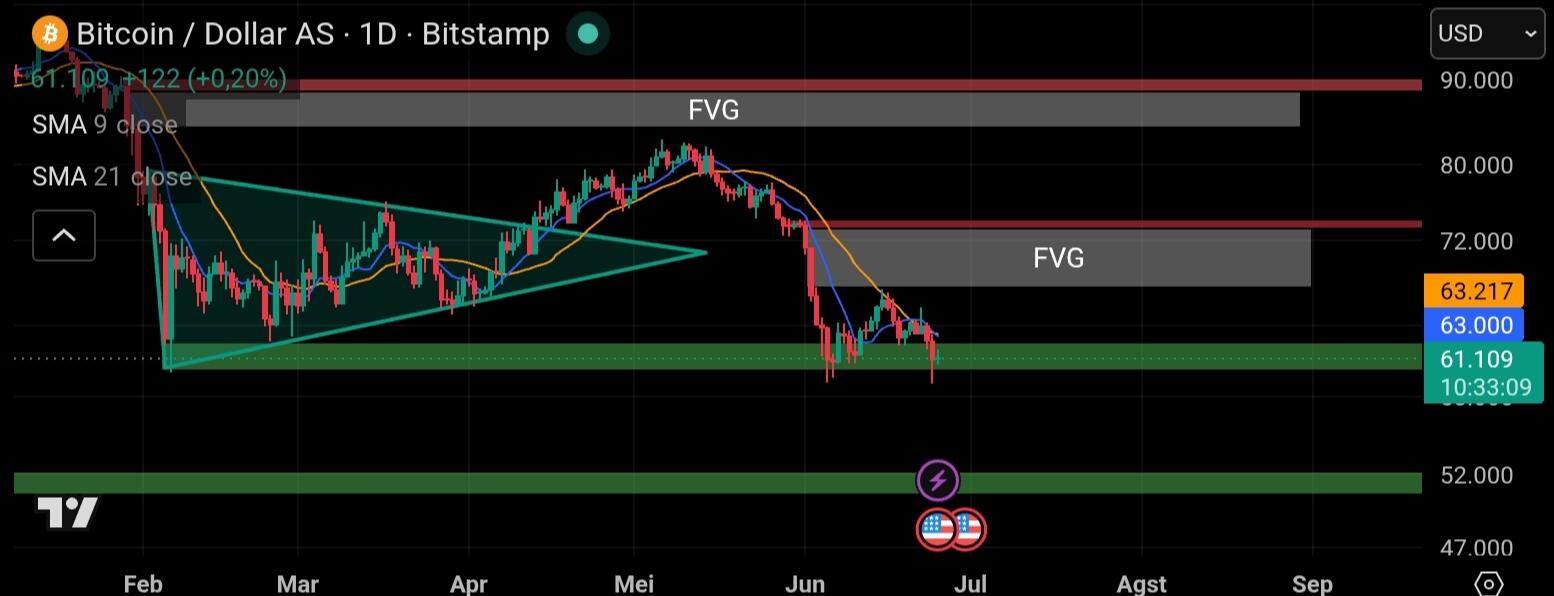
2. Bitcoin
On the daily interval Bitcoin has broken below its recent consolidations and is currently clinging to a crucial horizontal support level around 61.100 dollars. From a smart money concepts perspective this aggressive sell off has left behind prominent fair value gaps around the 72.000 dollar and 90.000 dollar regions. The asset is currently battling to maintain its higher timeframe structure to prevent a structural breakdown.
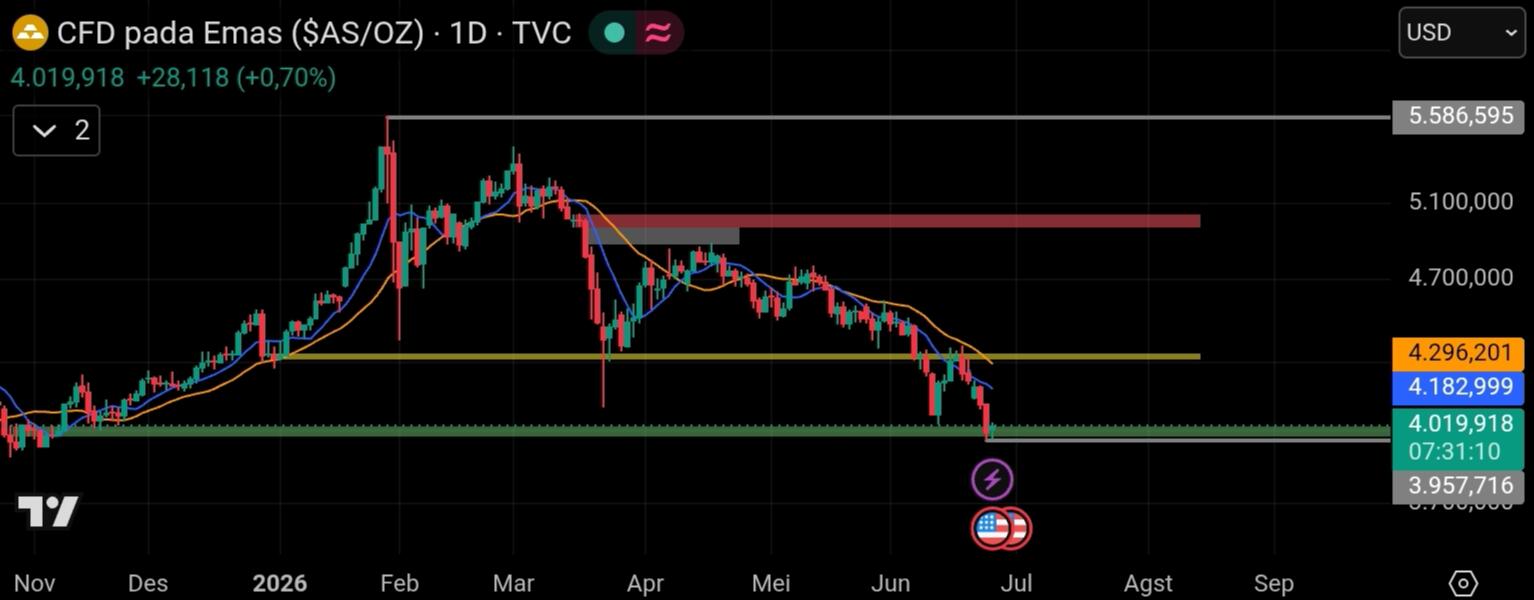
3. CFD Gold
Even the ultimate store of value is facing immense liquidations as institutional players clean up their balance sheets. After printing remarkable highs earlier this year gold has reversed heavily on the daily chart to trade at 4.019 dollars. This severe drop confirms that during an intense cash crunch macro fund managers will gladly liquidate their winning gold positions just to cover capital requirements elsewhere.
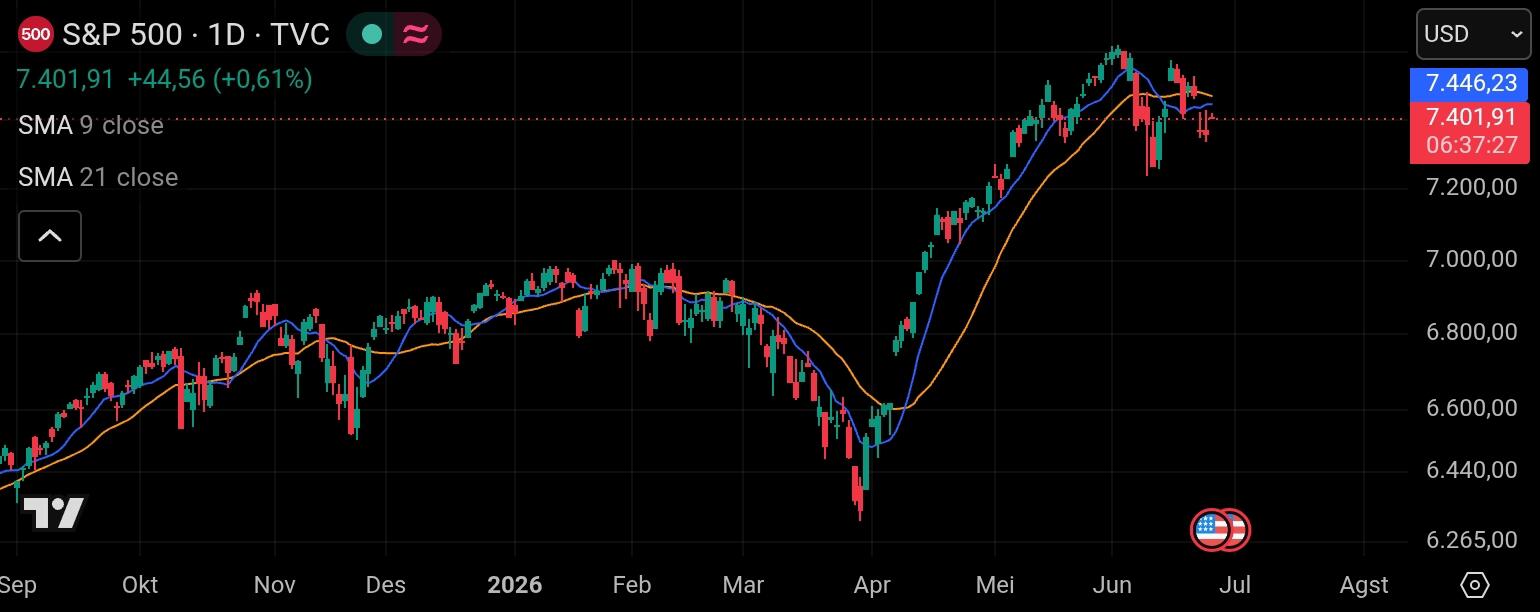
4. S&P 500 Index
The S&P 500 daily chart shows a clear distribution phase right after its incredible rally from April. The index established a local top around 7.446 before rolling over into a short term bearish market structure down to the 7.401 level. This clearly indicates that smart money is actively distributing positions into retail buyers amid growing macroeconomic worries.
My Opinion
Looking at the current market condition where everything is dumping together, my conclusion is simple. This is purely a global liquidity crisis caused by an overly powerful dollar or a DXY pump and it is not due to any fundamental damage to each individual asset. As traders we must understand the core rule that when the dollar index spikes and breaks key areas, all risk assets including tech stocks, gold, and crypto will definitely be under pressure because capital flows back into cash. The drop of bitcoin to the 61.000 dollar level or gold breaking down to 4.019 dollars does not mean their long initerm narrative is dead. Instead this is just a normal re pricing phase as the market responds to sudden tight macro policies.
The extreme fear indicator at 12 in crypto and the massive panic in stocks often serve as signals that the market is already nearing an oversold territory. The best strategy right now is to hold back from overtrading, avoid going against the current short term downtrend, and closely monitor when the US Dollar Index starts showing signs of weakness at its resistance area. Once the dollar cools down, that is exactly when liquidity will flow back in and trigger a strong reversal for the overall market.
Click here to read my authentic and original analysis
Sources