
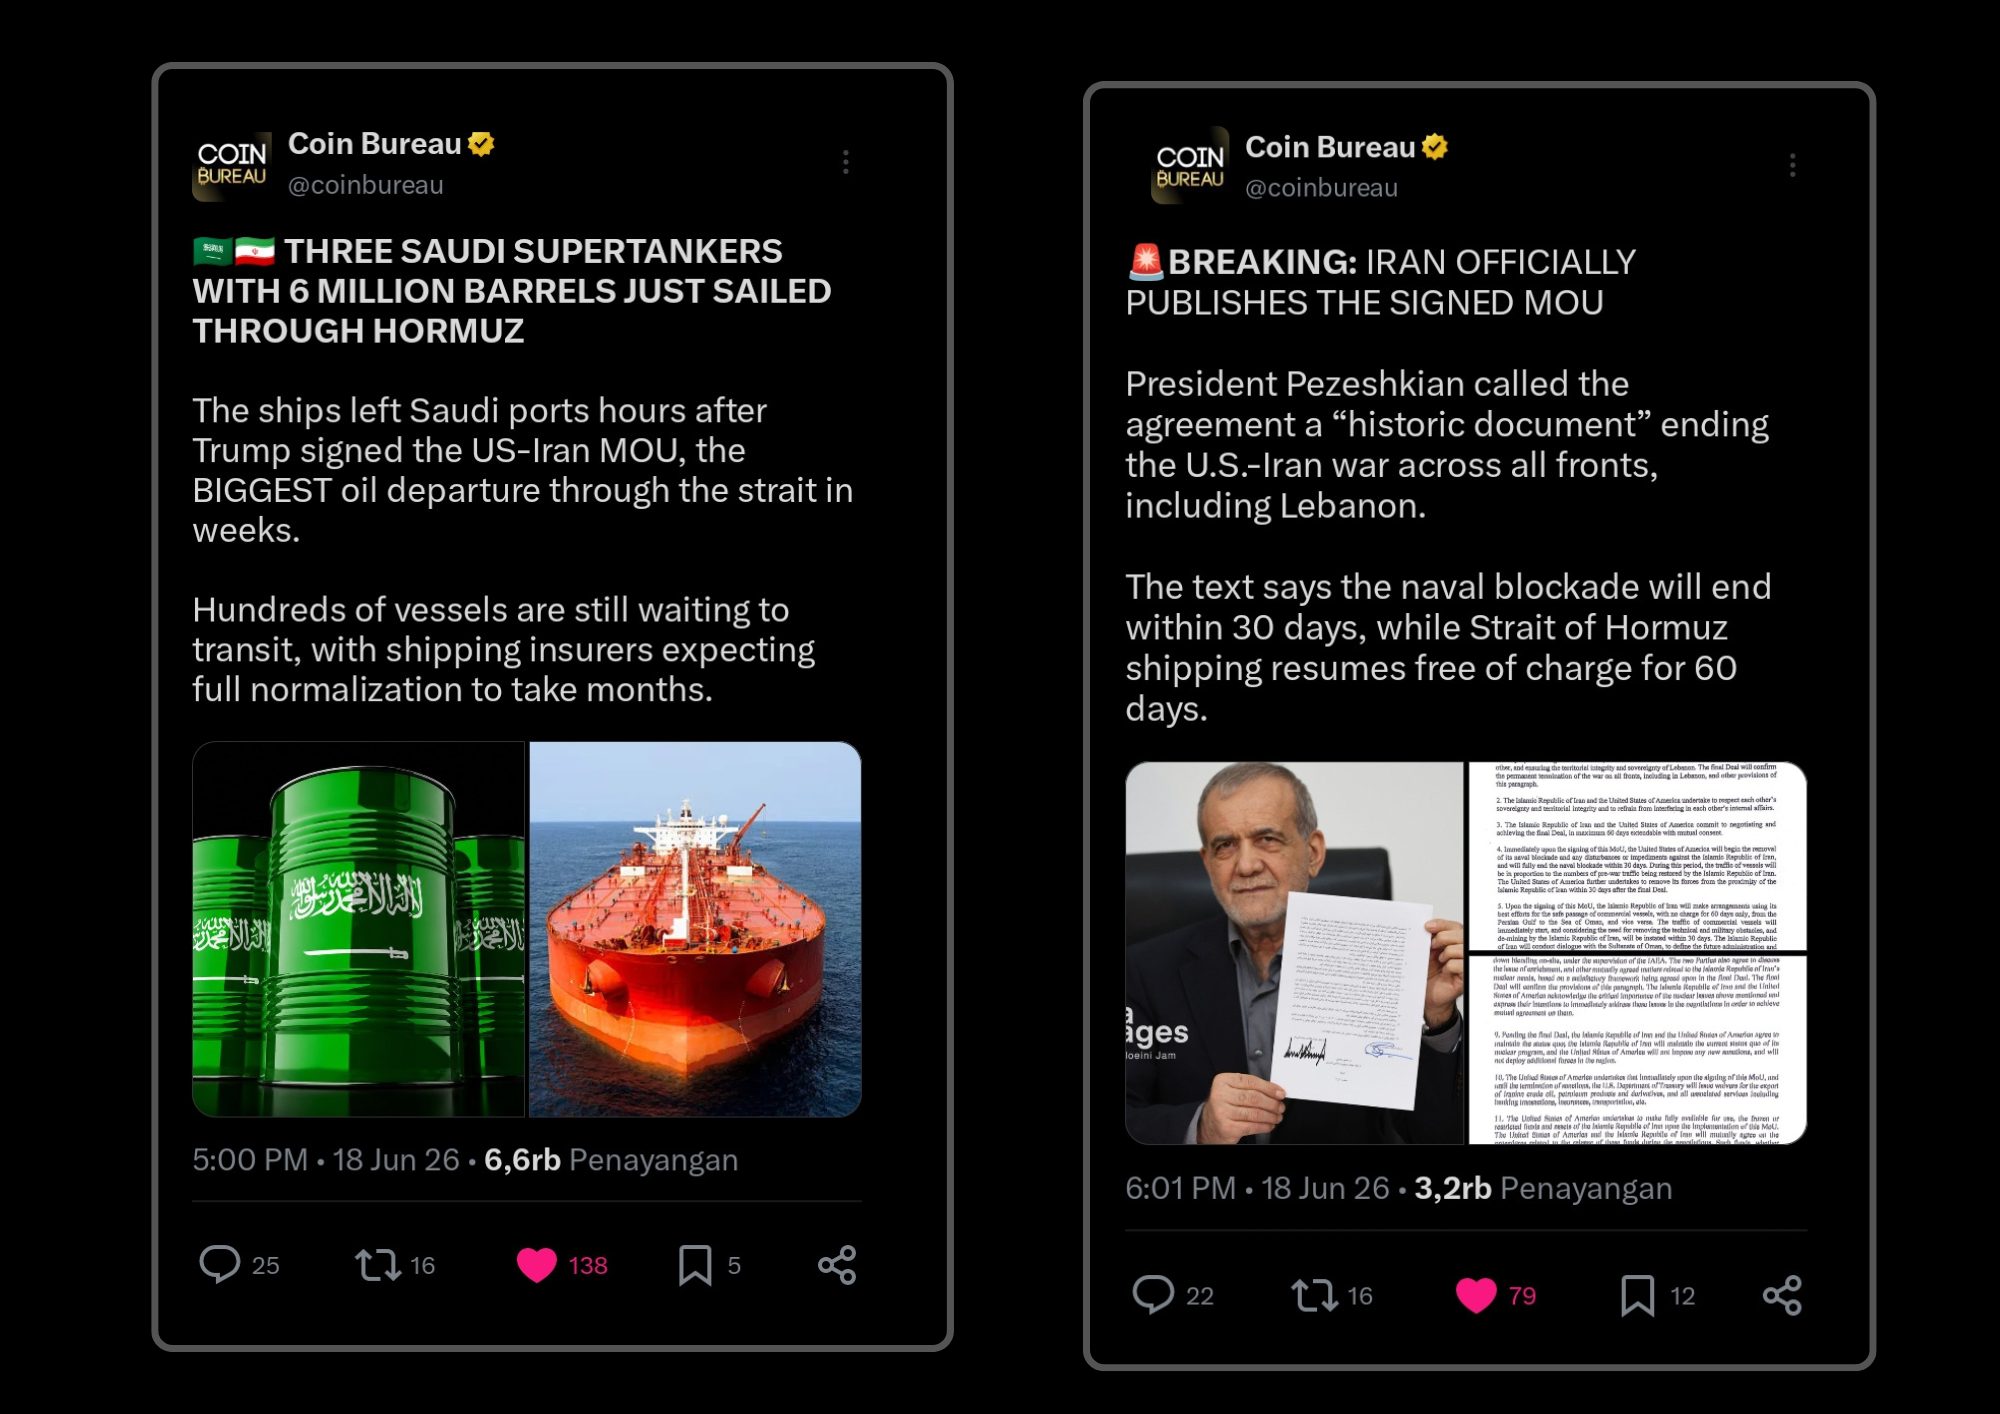
Geopolitical dynamics just took a massive turn and the entire commodity market is feeling the aftershocks right now. For anyone closely watching the crucial shipping lanes around the Strait of hormuz, the sudden drop in tension is the main talking point. US president Donald Trump and Iranian President Masoud Pezeshkian signed a historic Memorandum of Understanding or MoU which effectively brings a halt to the military standoff that previously threatened global energy stability.
The real world effects of this diplomatic breakthrough came almost instantly. Data shows that three massive Saudi flagged supertankers carrying roughly 6 million barrels of crude oil set sail through the strait of hormuz immediately after the paperwork was finalized. With the naval blockade completely lifted, commercial vessels can now navigate these waters free of any transit charges for the next 60 days while both nations iron out the final details.
This sudden wave of peace is transforming more than just the oil sector. Recent reports confirm that LNG transport fleets owned by major producers like Qatar are currently preparing to ramp up their regular transits through the strait. This is a massive relief considering their shipping volumes had previously plummeted by more than 90% when the regional conflict was at its peak.
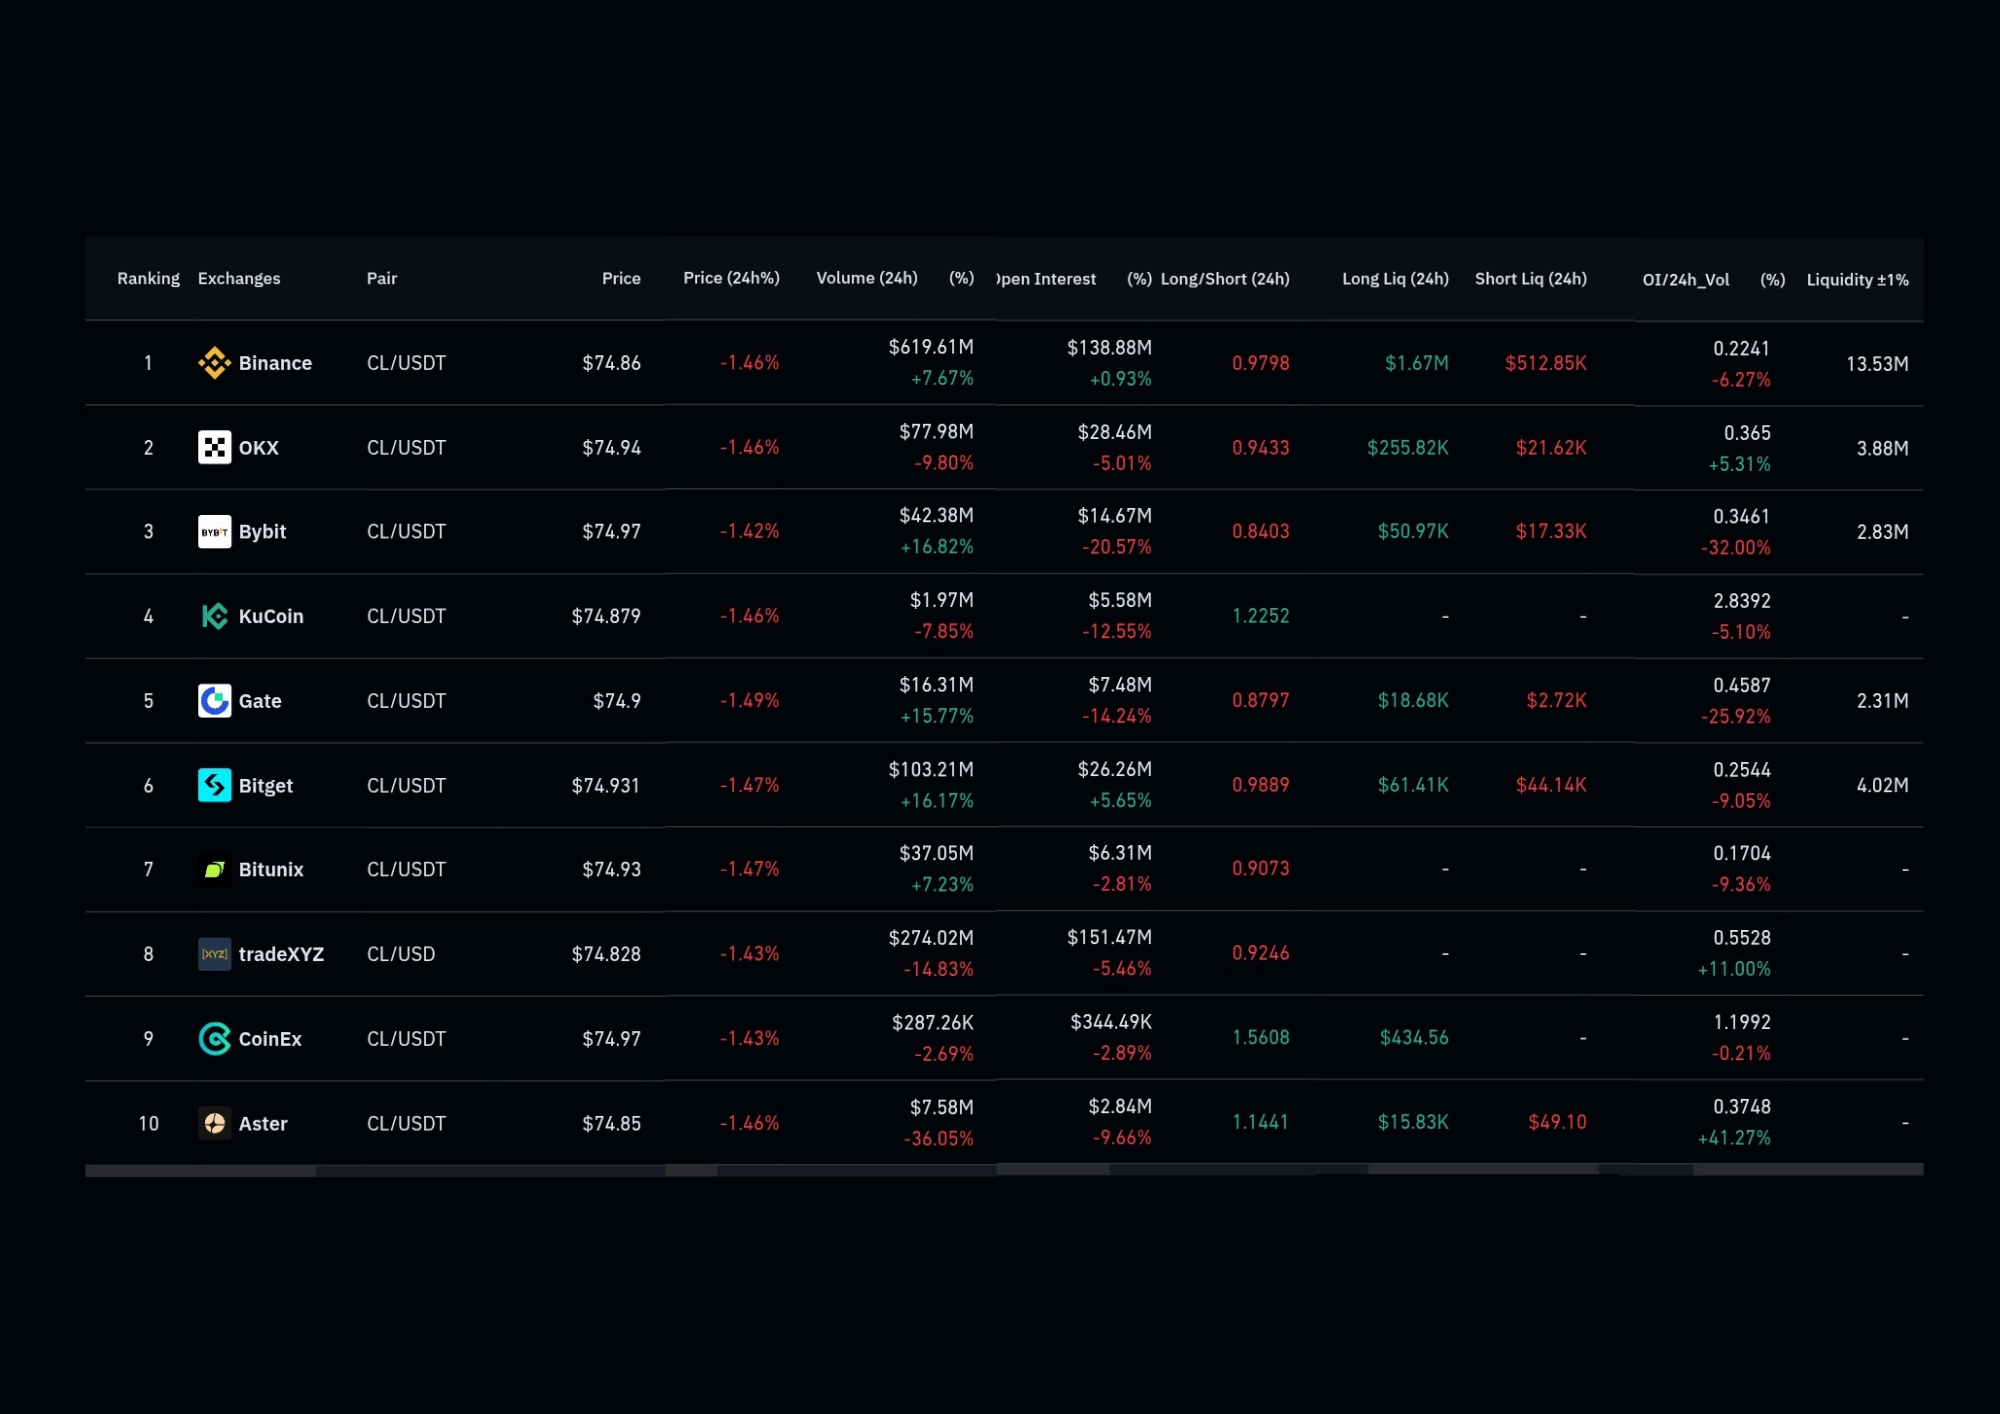
As expected, this massive influx of raw supply triggered an immediate wave of panic selling across the futures market. A quick look at the latest crude oil derivatives data reveals an incredibly packed trading environment across major digital asset platforms. Binance is leading the entire global liquidity pool by a massive margin with its total trading volume sitting at $620.29M and an Open Interest value of $138.88M. Right behind the leader we see tradeXYZ pulling in $272.33M in volume while OKX holds down its spot at $77.16M.
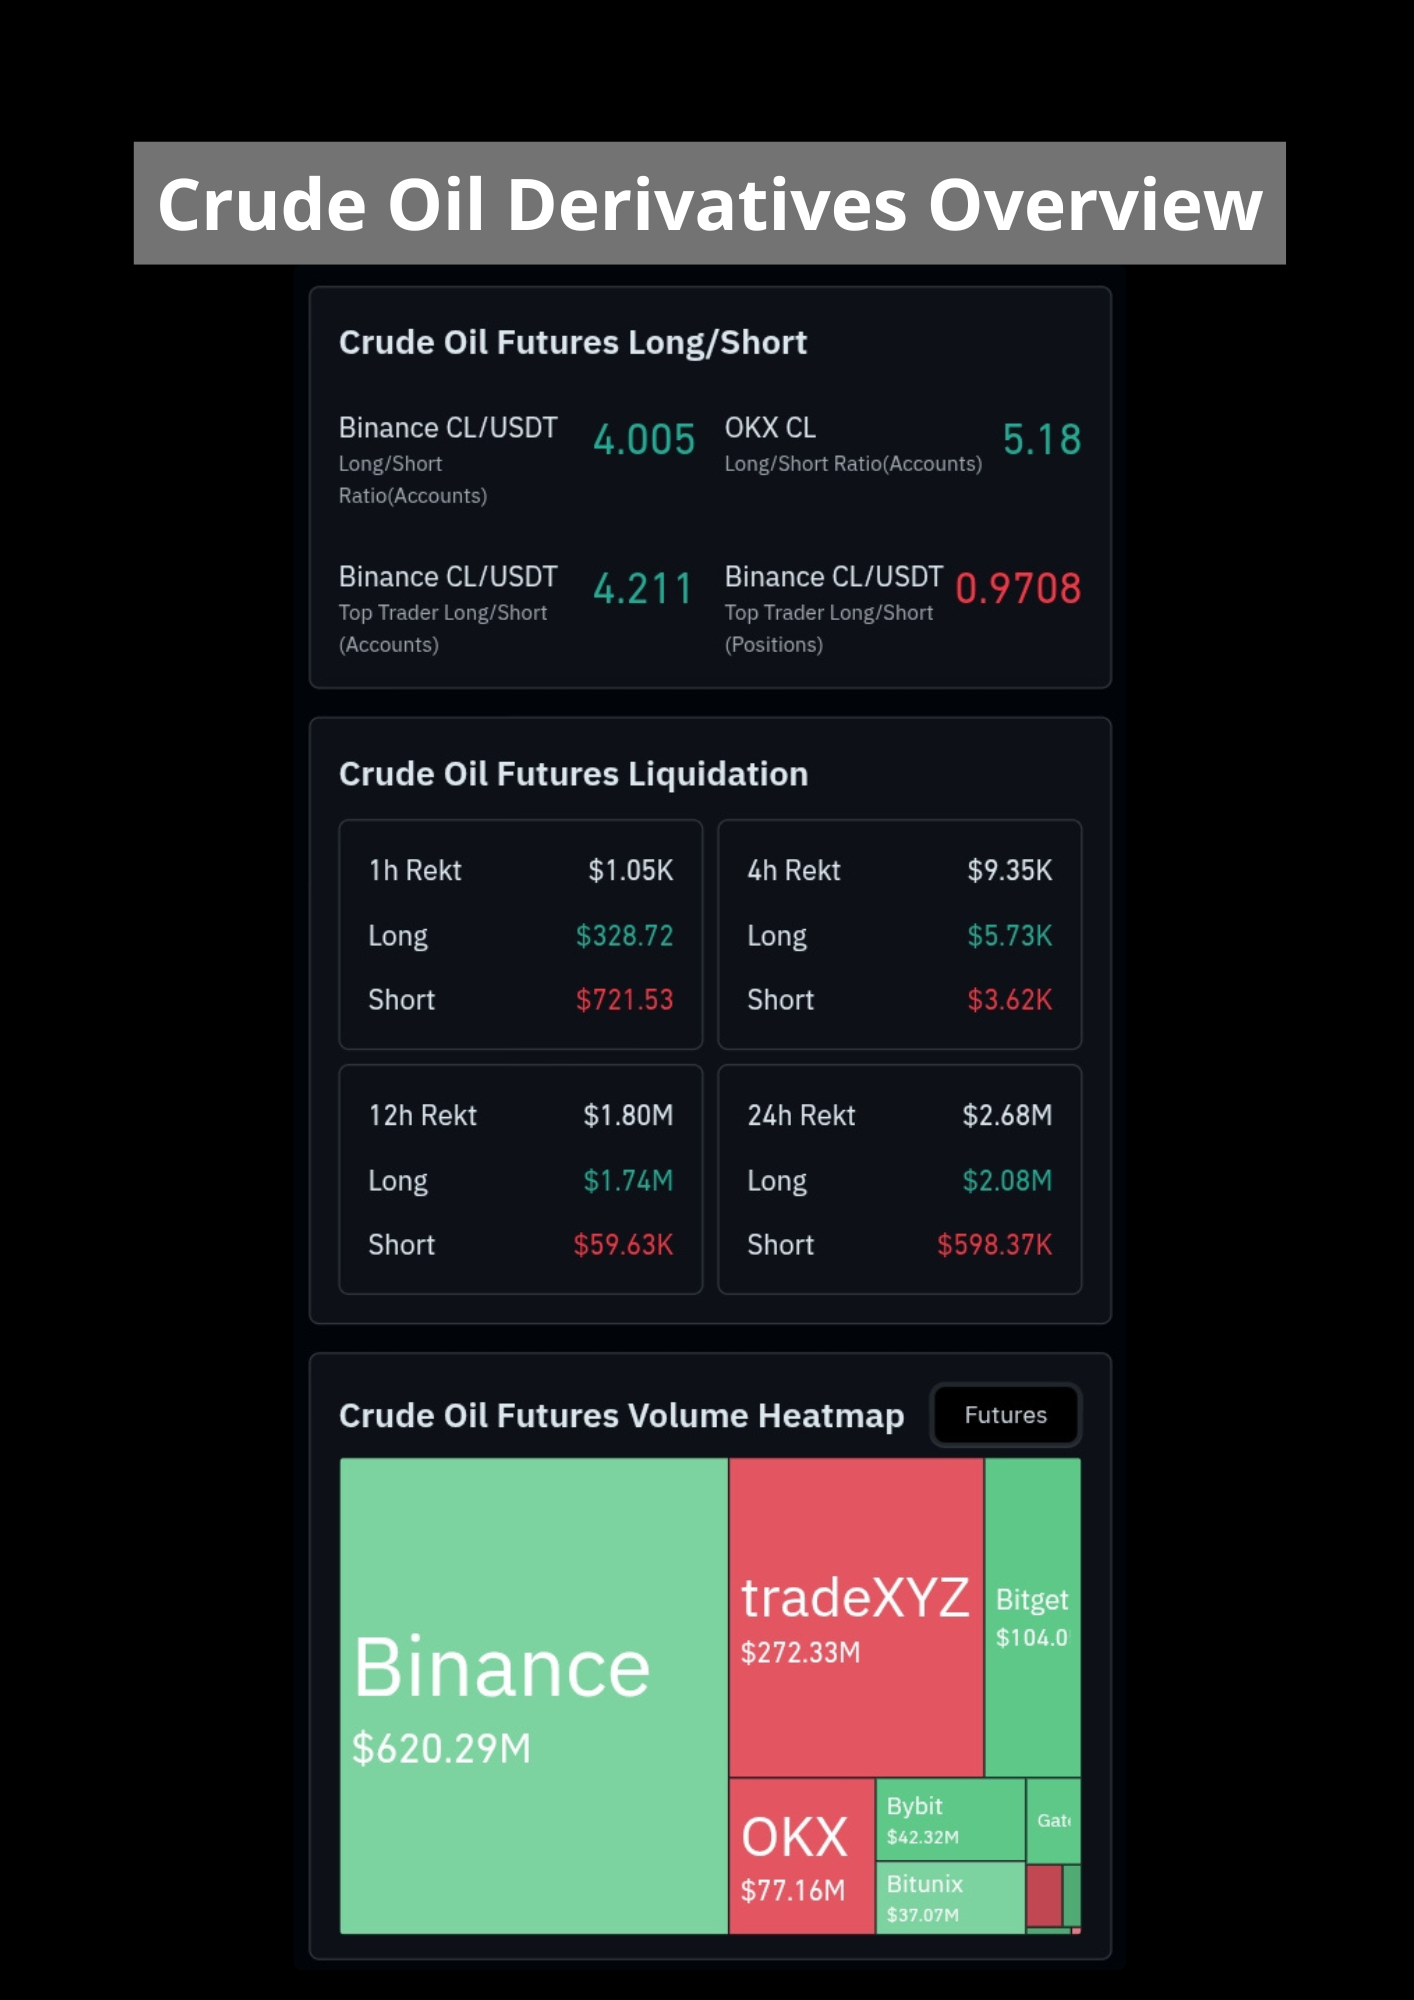
Because of this heavy liquidation pressure, global crude oil prices took a direct hit and dropped down to the $74.80 per barrel mark which is roughly a 1.46% decline in less than 24 hours. This sharp downside move resulted in a major wipeout for overleveraged traders where total long positions crushed or rekt over the last day reached $2.08M. On the flip side, liquidated Short positions were kept minimal at just $598.37K. This massive gap proves that top tier traders on these heavy exchanges were strongly aligned in driving the market downward.
"So how should we read this oil market crash in relation to Gold price movements?"
The macroeconomic connection is pretty straightforward. When global energy prices experience a steep decline, overall manufacturing and living costs go down which automatically cools off global inflation numbers. Consequently, central banks around the world lose their primary justification for keeping interest rates aggressively high. It is completely normal for gold to get temporarily dragged down alongside oil during the initial phase because the immediate market panic starts to evaporate. However, once gold hits a relatively cheap price point, the broader investment landscape shifts. Experienced market participants quickly recognize this as a prime opportunity to accumulate a premier safe haven asset at a steep discount.
My Opinion
When you analyze the current charts from a purely technical perspective, the immediate trend looks intimidating and definitely gives off a short term crisis sentiment for anyone holding spot komoditas. However, if you approach this market with a long term investment mindset, the current structure offers an incredible vision for building up a solid position.
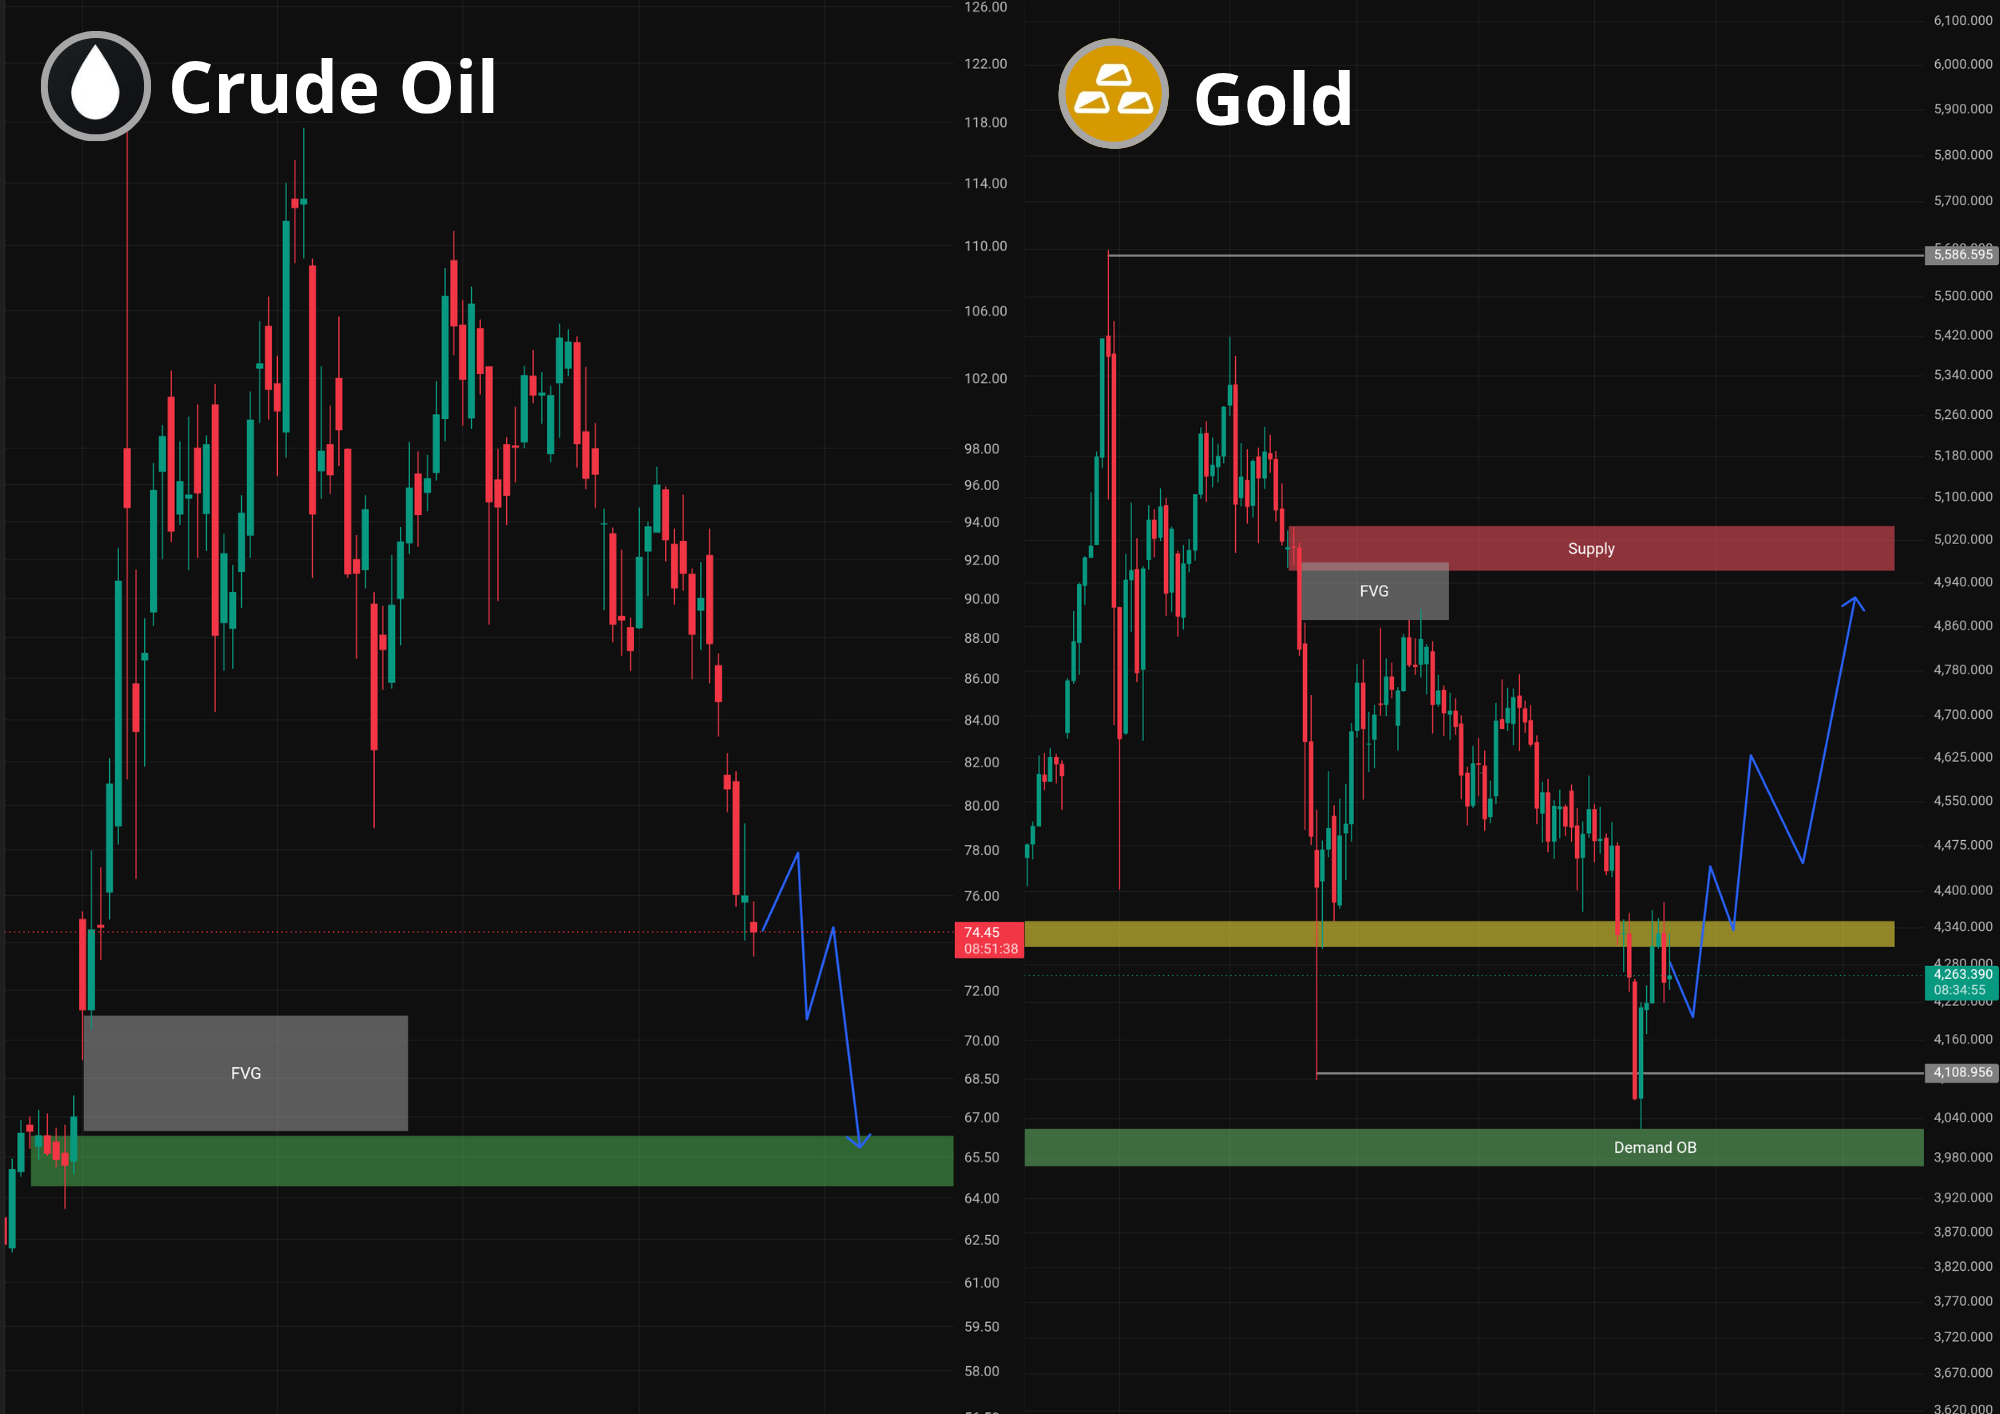
Looking closely at the Crude Oil technical setup, the ongoing price drop is steadily moving toward a major historical Support zone located right between the $66.35 - $64.40 price range. What makes this setup highly interesting is that before the price can test that specific green demand area, it left behind a noticeable price jump that created a fair value gap or FVG. Under the core principles of smart money concepts or SMC, price action has a natural tendency to retrace downward to fill or mitigate these empty FVG zones while simultaneously sweeping up resting liquidity before it can mount a healthy long term bounce. The recent geopolitical breakthrough in the Middle East serves as the exact fundamental driver needed to complete this technical target.
Switching over to the Gold chart, the underlying market structure looks exceptionally promising. After taking some heat from the broader oil sell off, gold is currently stabilizing inside a clear consolidation or sideways range which is highlighted by the yellow box. This specific area is acting as an initial Support barrier within the $4.026.000 - $3.966.200 price parameters. Furthermore, right beneath this yellow box sits a heavy demand order block or demand OB area that is perfectly positioned to absorb any extended downside moves.
The broader positive vision here centers around a highly probable price reversal in the coming months. This sharp market correction is simply offering us an optimal window to go gold shopping at highly depressed prices. Once the oil market establishes its absolute floor within its designated support range and global investors remember that other major economic uncertainties are still lingering, capital will inevitably rotate back into hard safe haven assets. The primary target for this gold reversal will be reclaiming the upper FVG area and testing the next major Supply or Resistance zone which sits much higher up around the $5.050.000 - $4.960.720 level.
To sum it all up, the current downside momentum is merely a calculated market flush designed to hunt down liquidity. For those of us who track market structure with precision, watching oil head toward its lower FVG target while gold trades at a clear discount represents the absolute best time to map out an entry strategy so we can maximize our gains when the market turns.
Click here to read my authentic and original analysis
Source
- Coin Bureau
- Oil prices fall, stocks rally as US, Iran sign framework to end war
- LNG shipping through Strait of Hormuz poised for gradual restart
⛔ Disclaimer: This article is strictly for informational and educational purposes only. It does not constitute financial advice, and no trading signals are provided.
Financial market trading including crypto, forex, and stocks involves high risks. While there is a potential to achieve substantial profits, there is an equal or even greater risk of experiencing severe losses, including the loss of your capital. Past market performance does not guarantee future results.
All investment decisions are your sole responsibility. Please ensure you conduct your own research (DYOR) before making any trades.