Now-a-days Bitcoin is failing to break the resistance of $10,000. As June started very violently for Bitcoin. At the starting of the month Bitcoin touched it's highest price of the three months resistance of $10,500. However, it dropped so quickly to the $9,135 on BitStamp and even more on BitMex.
Over the past few day Bitcoin is getting little stability and there's decrease in price volatility as well as it has been seen a significant drop in the trading volume as multiple traders are staying away from the volatility. Taking the RSI indicators into account which is indecisive around the 59 neutral areas. All that time Bitcoin kept trying to break the psychological barrier but due to the heavy sell-off which again brought Bitcoin down from it's resistance level. The bottom line is that there is increase in the chance of bearish 🐻 movement.
SUPPORTS AND RESISTANCE LEVEL
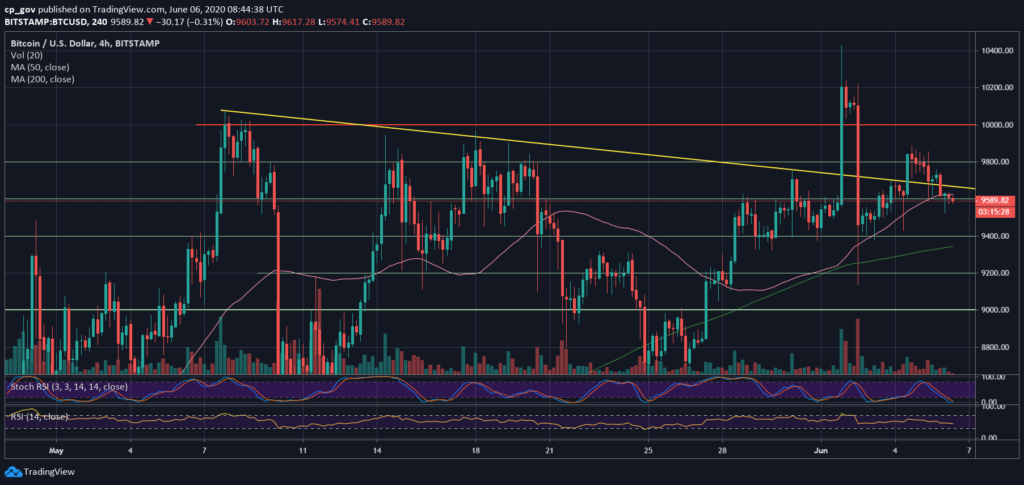
Currently looking at the chart, the major area of resistance lies around $9,650. Only if the the Bitcoin price candle crosses the line and move above that line then only the breakout will be confirmed.
We also have to remember that the whole area until $10,000 is full of demand chunks – especially around $9800. In case Bitcoin breakout current resistance then the first five digit resistance lies around $10,200, which will be closer to the highest value of the year that is $10,500.
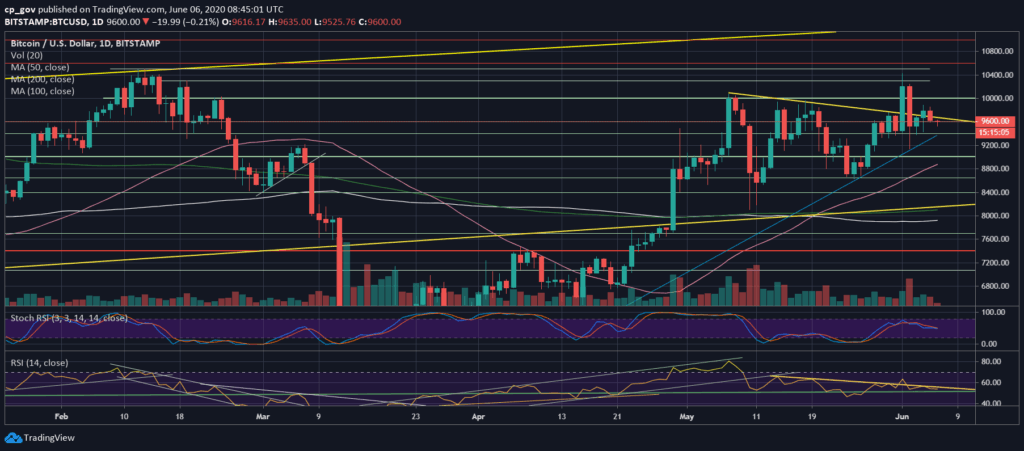
We mostly look at the bullish side but that would be unfair for both the bears as well as our price analysis. So looking at the bearish side, the first significant resistance lies around $9,400 along with the blue ascending trend line as shown in daily-chart.
Checkout the the Bitcoin related Data :


