
As of the time of writing Ethereum is sitting at 2075$.
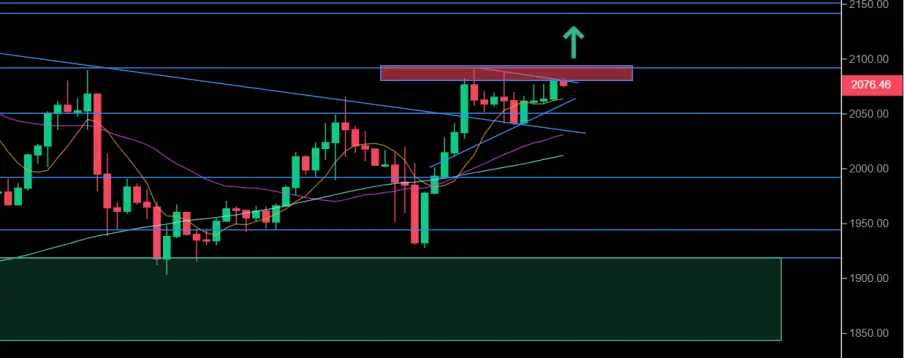
In yesterdays technical analysis I mentioned that the bounce from the 2050 level was promising as we broke above a large descending triangle. We are right now on the verge of a breakout.
Potential trade in the 1 hour time frame:

As we can see a descending triangle is forming.
There is also the strong resistance rectangleacting between 2080-2092 (red rectangle), which could make breaking the pattern to the upside a little difficult, as we are still lacking momentum.
However we are looking more bullish then Bearish, and thus it really would not be suprising if we broke above within the next 24 hours.
Bearish scenario:
As long as we hold above the 2050 level, we could well be on our way to retest the 2120-2150 resistance. Which if we do reach, could cause a massive FOMO reaction as this will have been the highest price for Ethereum this year.
If we do Break the 2150 level, the next level is 2250, we could extent all the way to 2350 if momentum and the bulls allow us.
JOIN THE TECHNICALS WEEKLY GROUP CHAT FOR TRADING SIGNALS !!!
https://t.me/+3lyYHuF8qx5hNzJk
Consider following me if you want to stay up to date on the market !






