BTC high time frame
Monthly chart still looks super bullish
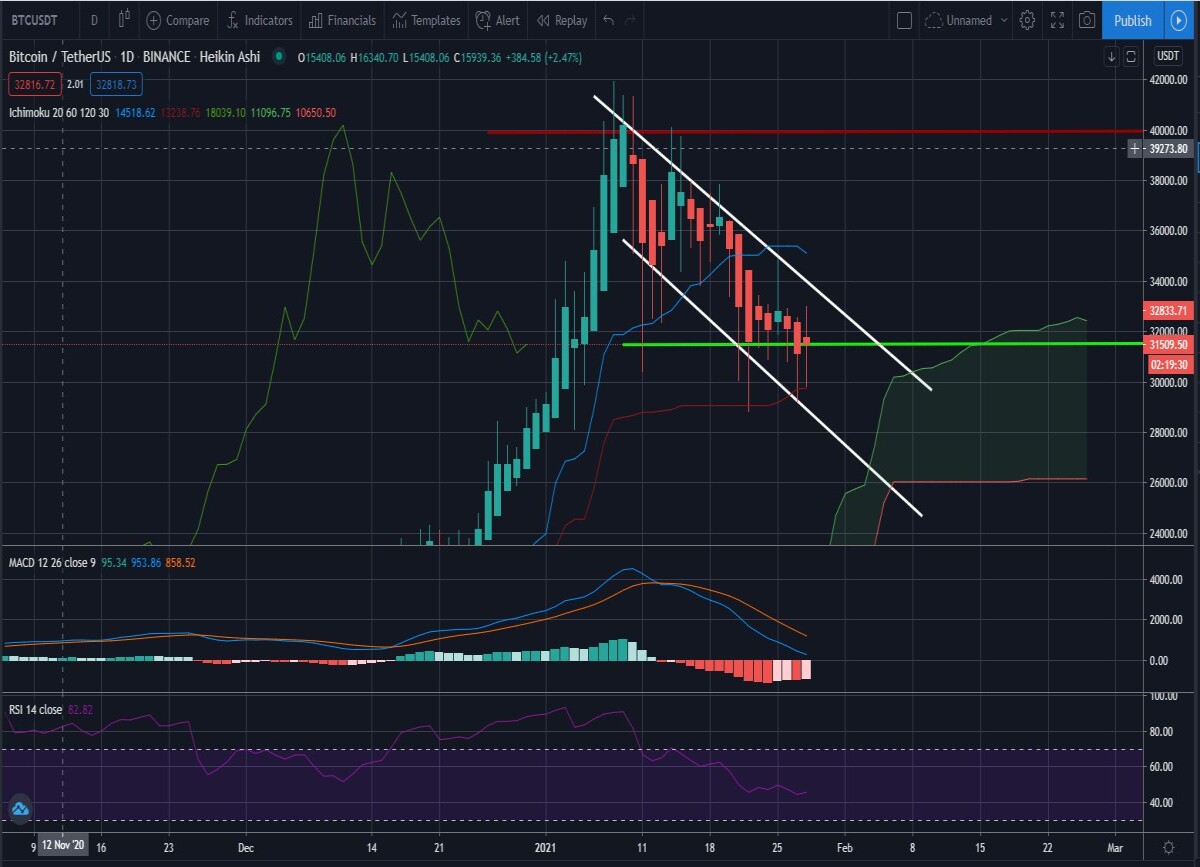
Daily chart Ichimoku: the red line shows a strong resistance close to the ATH, green line should be our support line, but it seems to me this will be a downtrend, at 26k should be a strong support, but if it fails the price will drop to 24k or worst case scenario 20k (unlikely). In my opinion this downtrend will be done in the first quarter of February then slowly we can start to test the new resistance level, which will be 30-30k. But if we could break out from this channel, the next resistance level will be 36k.
Daily chart 4 EMA: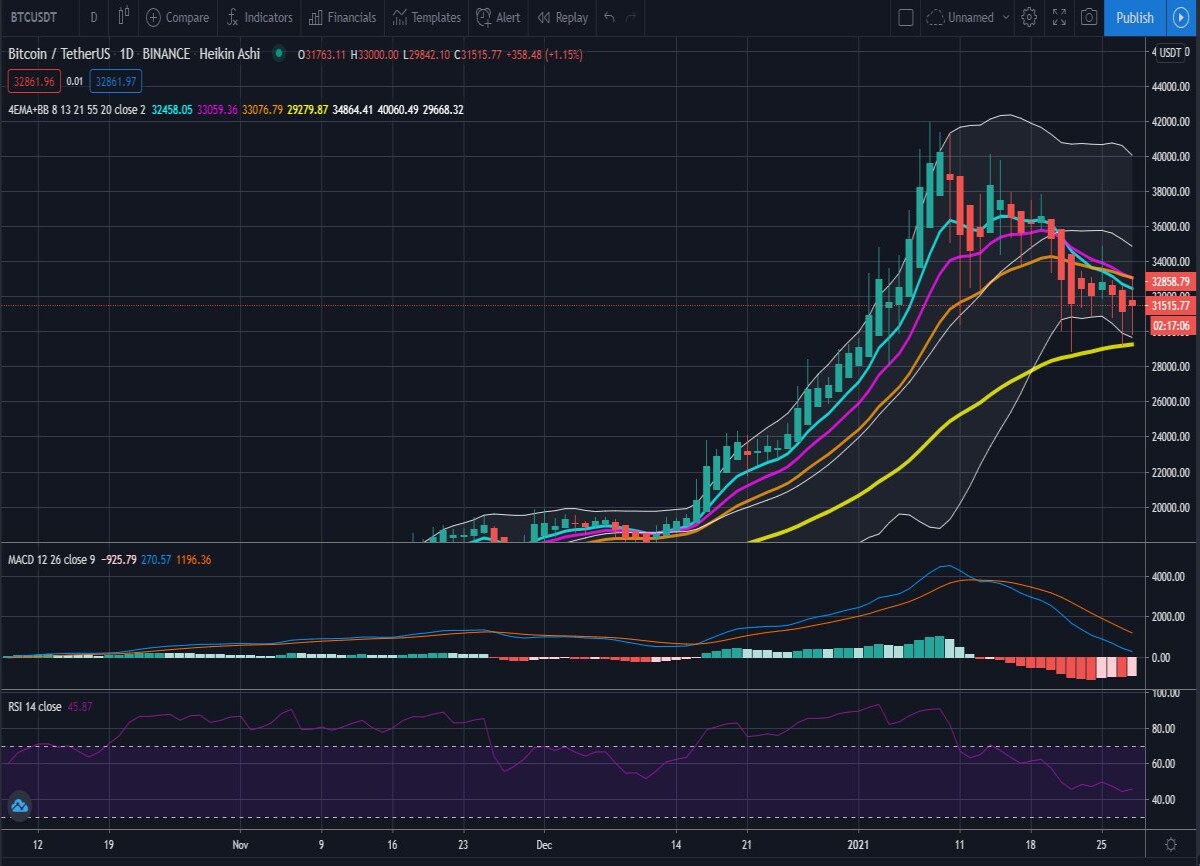
4h chart Ichimoku: the green cloud (kumo cloud) represents in this case the resistance level, 35500 if we could break out the next level would be around 37800. 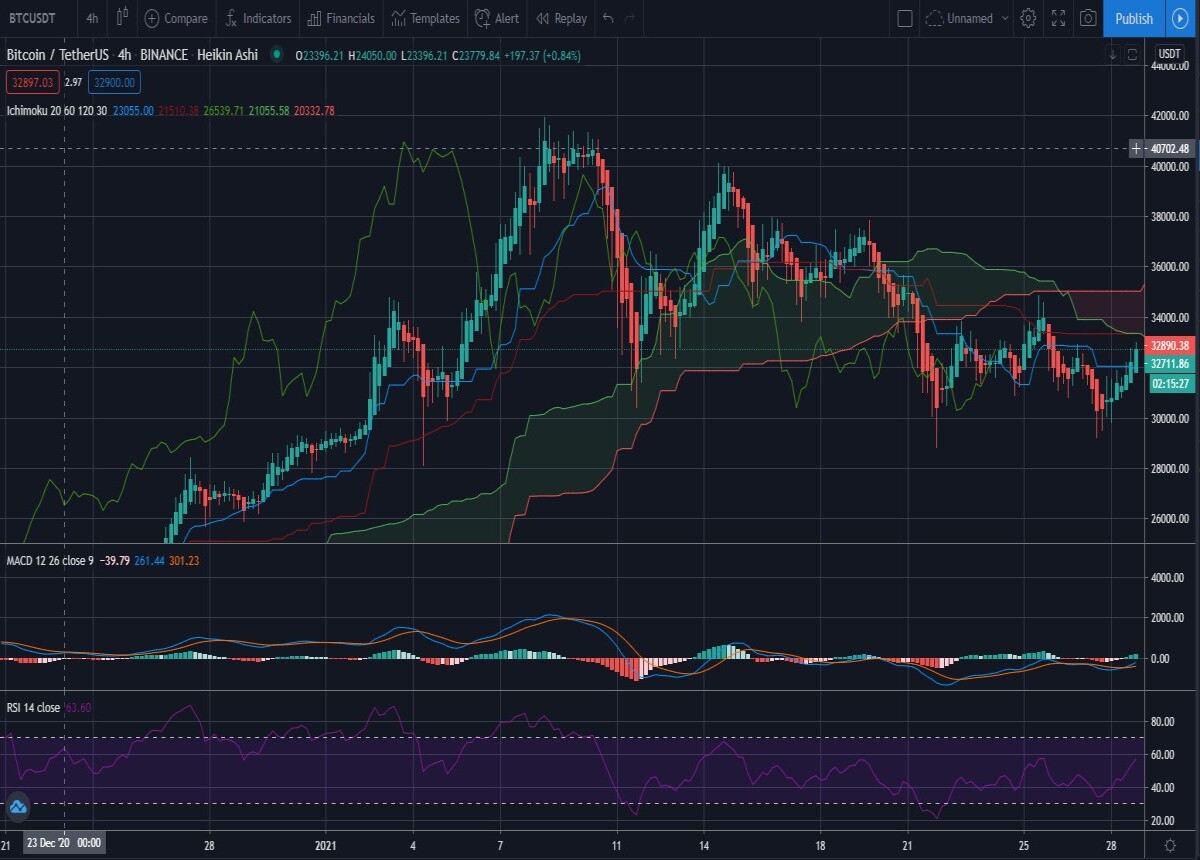
4h chart 4 EMA: the yellow 55 day moving average must cross the other moving averages, that would be a bullish signal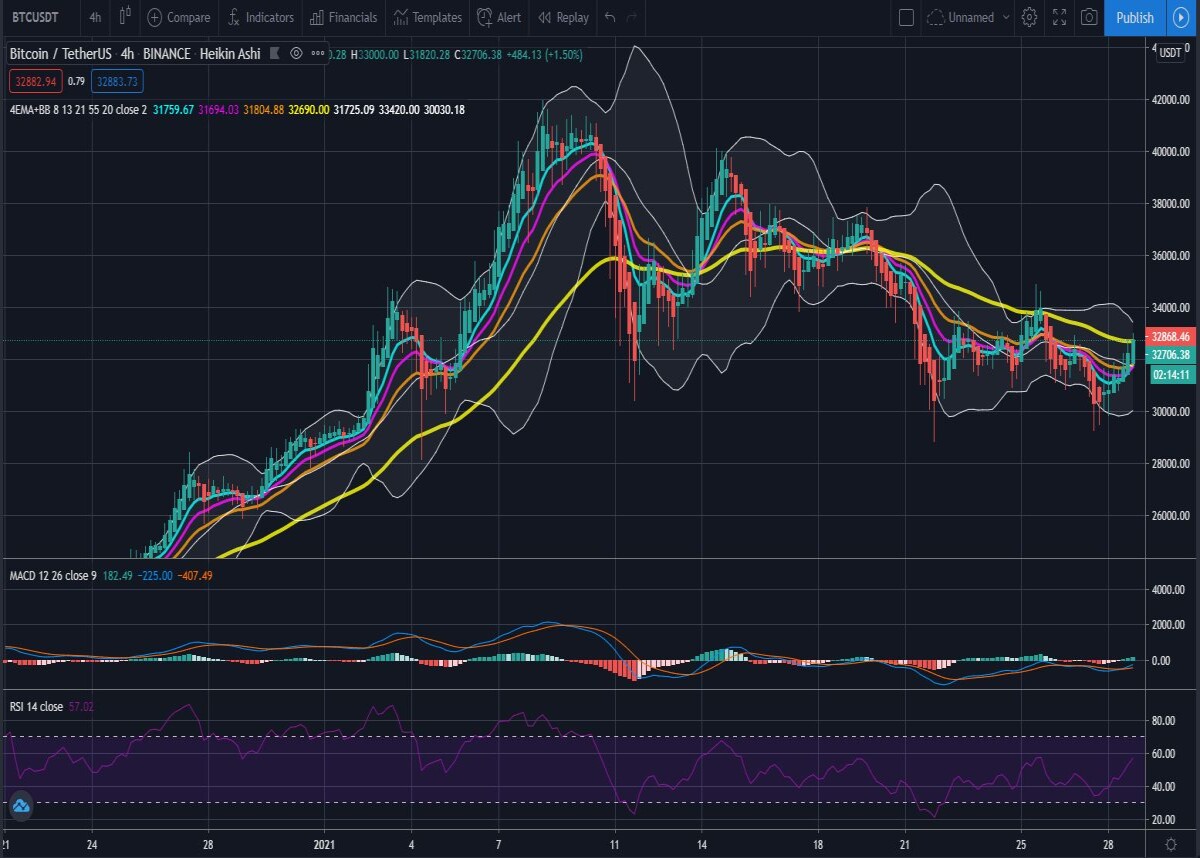
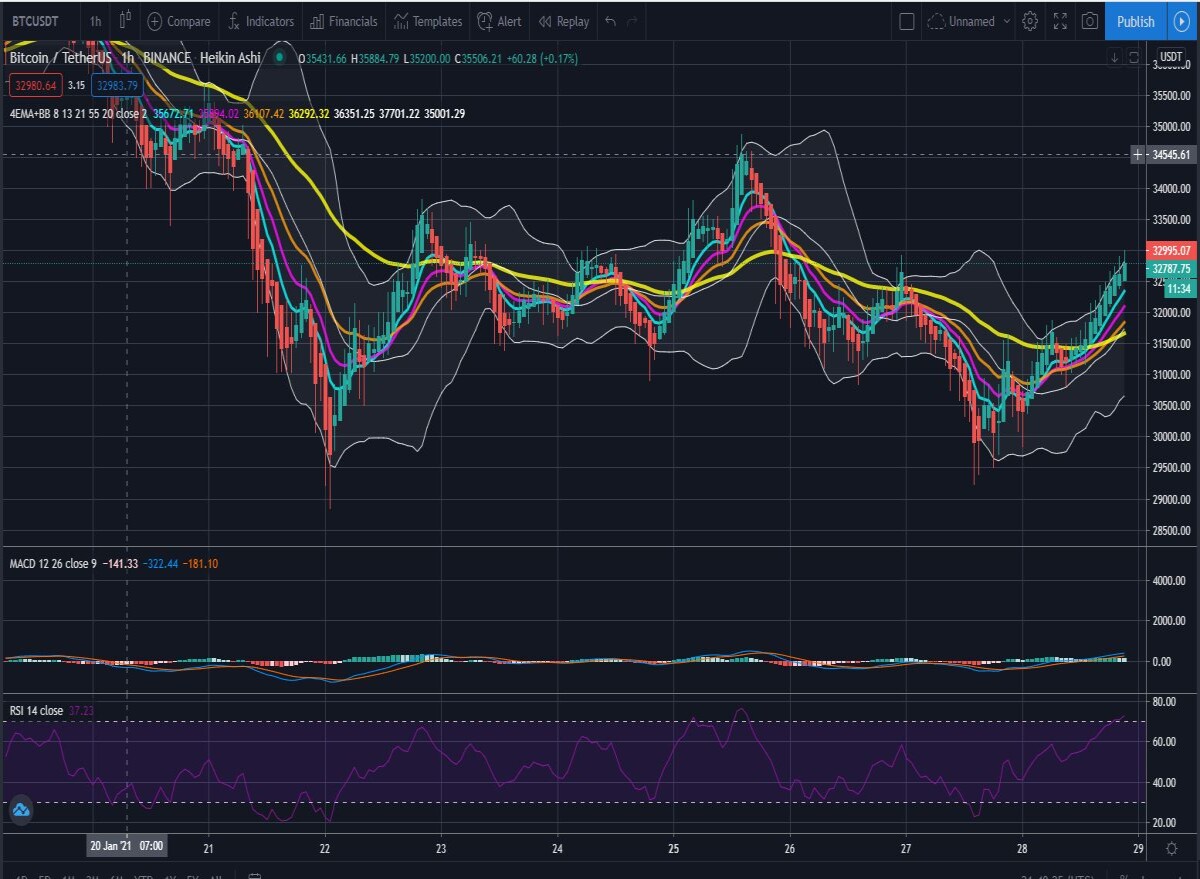
1h chart Ichimoku: hourly chart looks nice, we will see what happens at the resistance point, next stop 34500-35500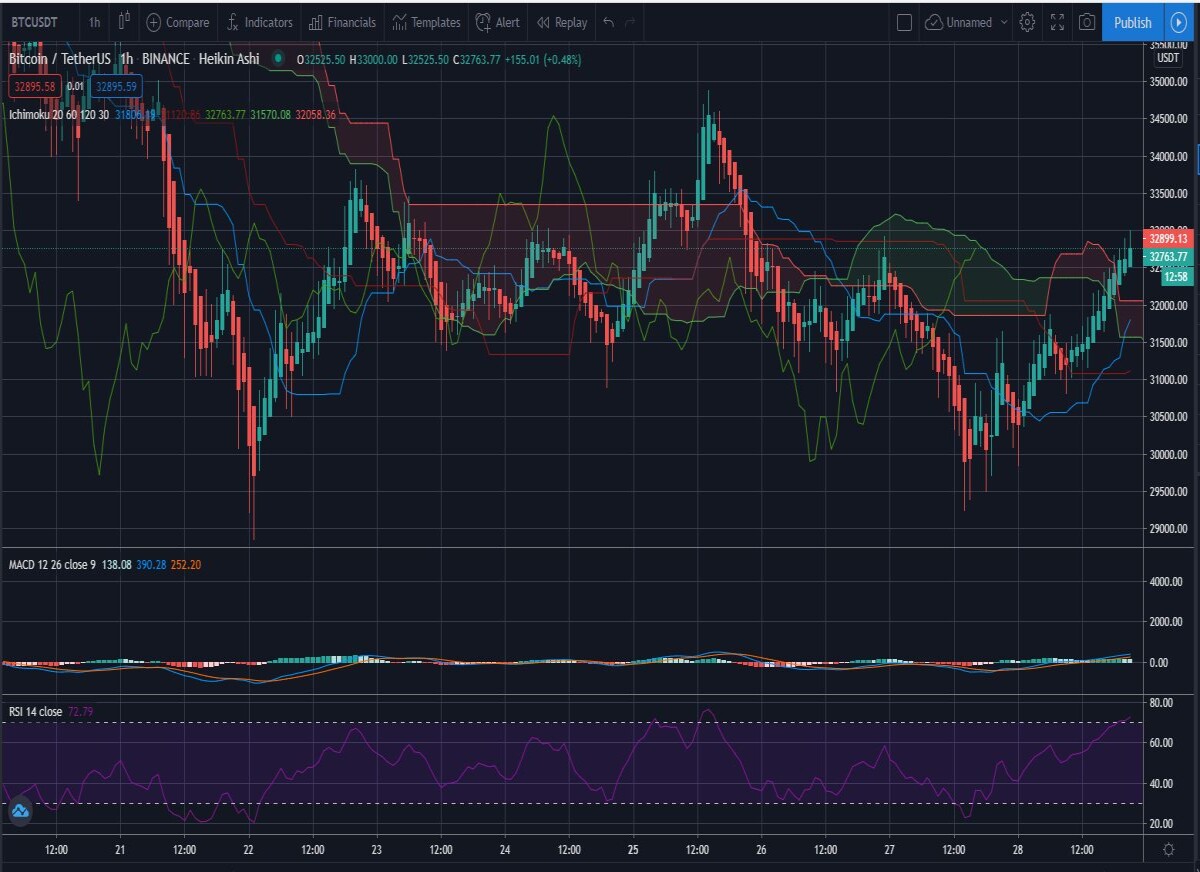
1h chart 4 EMA: so far so good