The Ethereum price managed to print a slight gain over the past 24 hours to trade at $3,497.30 at press time.
This slight uptick in the ETH price comes after the U.S. Securities and Exchange Commission (SEC) approved the listing of multiple spot Ethereum ETFs (exchange-traded funds).
A Bearish Chart Pattern Forms on ETH’s Daily Chart
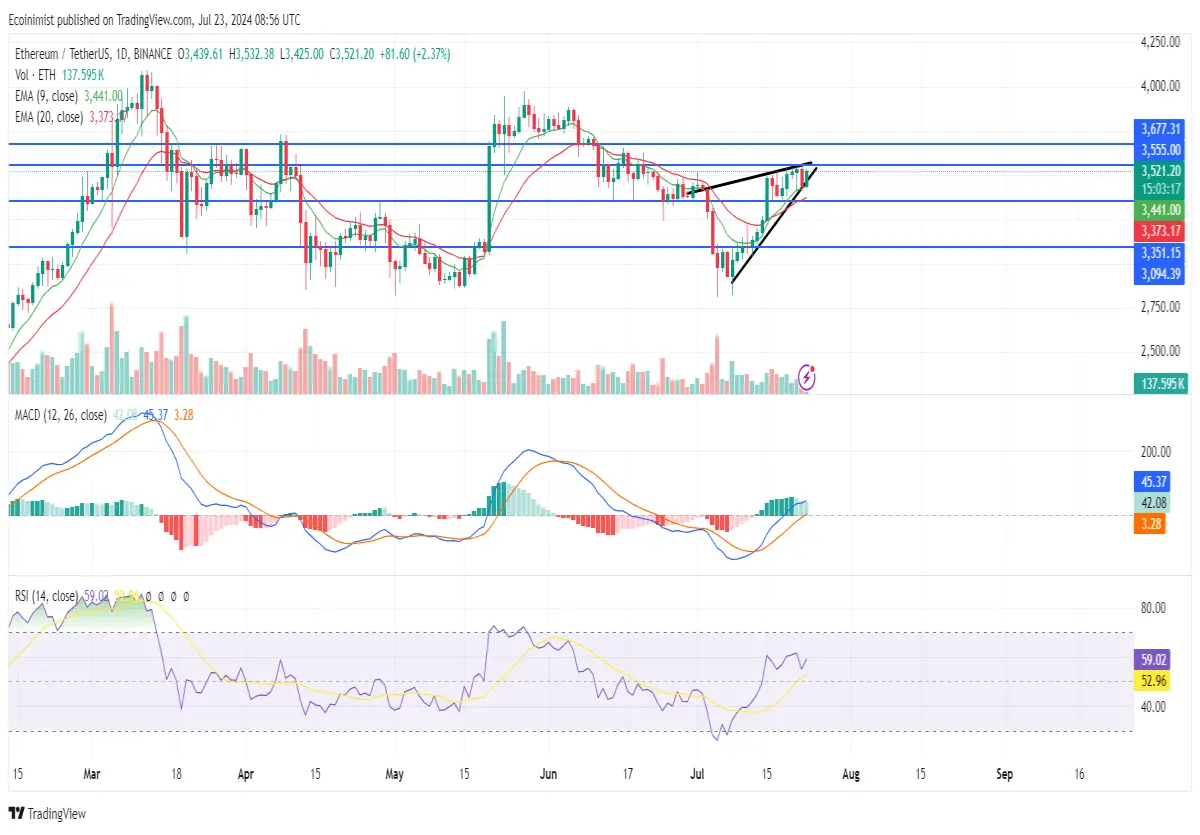
Daily chart for ETH/USDT (Source: TradingView)
The Ethereum price was rejected by the major resistance level at $3,555 in the last 48 hours, resulting in a retracement to the 9 Exponential Moving Average (EMA) line. If the leading altcoin falls below this technical crutch, ETH might be at risk of falling to the $3,351.15 support, which is also confluent with the 20 EMA line.
Also read: How To Start Staking Crypto on Coinbase: A Step-By-Step Guide
Traders and investors will want to take note of the bearish rising wedge pattern that has formed on ETH’s daily chart. This specific pattern suggests the Ethereum price might undergo a strong correction. If this pattern is validated, the crypto’s price could fall below the $3,351.15 support and possibly fall to as low as $3,094.39 in the short to medium term.
However, the Ethereum price might still bounce off of the $3,351.15 support if the rising wedge pattern plays out. This could be a pull back before the altcoin rallies above $3,555 to potentially rise to $3,677.31.
This potential price drop might not even happen if ETH manages to close a daily candle above $3,555 within the next 3 days. In this alternative scenario, the Ethereum price might attempt a challenge at the aforementioned $3,677.31 resistance.
Related: How to Create an Ethereum Wallet: A Step-by-Step Guide
Technicals Warn the Ethereum Price Might Pull Back
Technical indicators on ETH’s daily chart warn the Ethereum price might drop in the next 48 hours. Both the Moving Average Convergence Divergence (MACD) and the Relative Strength Index (RSI) indicators are on the verge of triggering major bearish flags.
Although the MACD line is currently positioned bullishly above the MACD Signal line, the narrowing gap between the two indicators warns that the positive cycle might soon come to an end. Meanwhile, the RSI is closing in on its Simple Moving Average (SMA) line on the daily chart, which could signal a bearish shift in strength if the two lines cross in the next 48-72 hours.
Disclaimer: The information presented in this article is for informational and educational purposes only. The article does not constitute financial advice or advice of any kind. Ecoinimist is not responsible for any losses incurred as a result of the utilization of content, products, or services mentioned. Readers are advised to exercise caution before taking any action related to the company.