
Since the march sell off bitcoin has mostly been sticking to a simple routine, pump -> range - > fall through support.
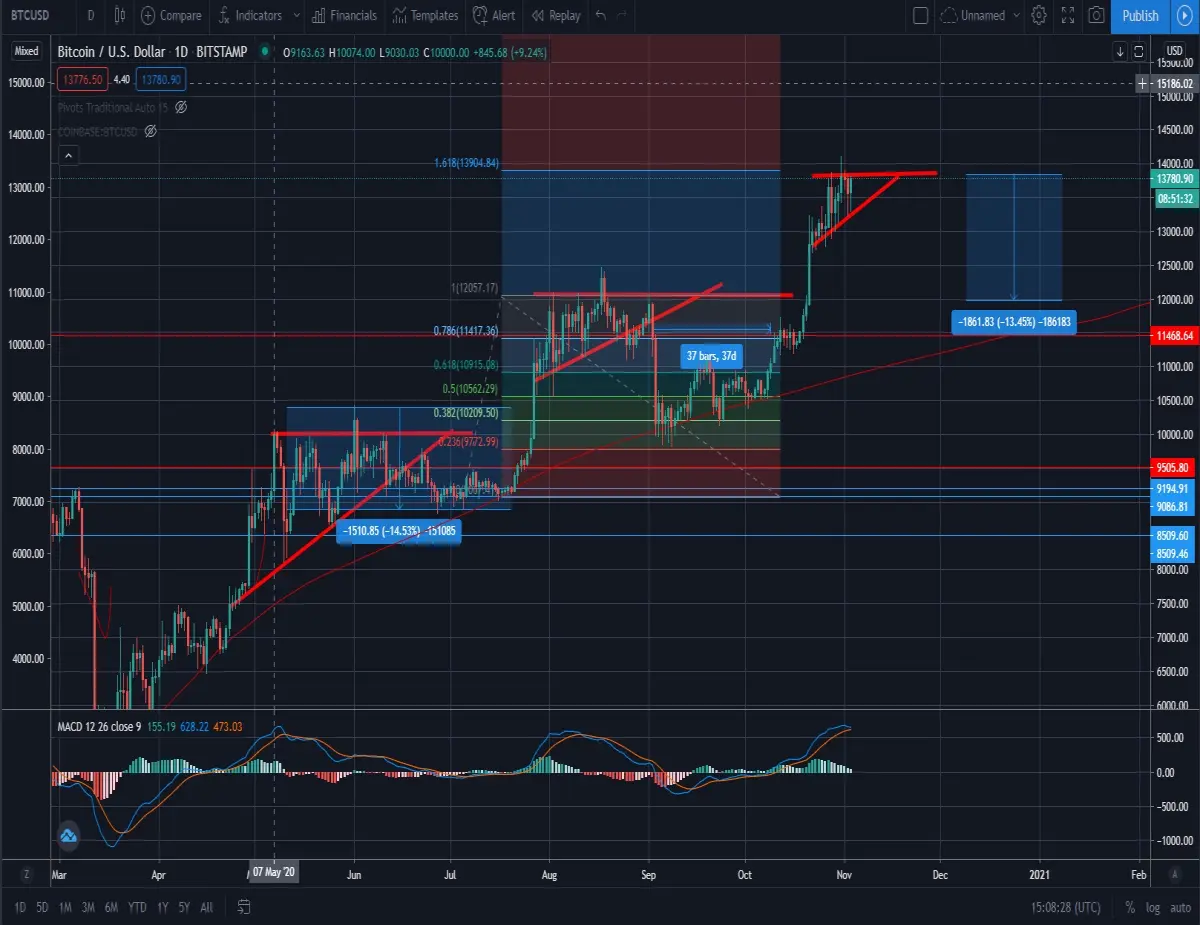
On the chart this can be seen as a series of ascending triangles
What can be learn here?
Some things of notes is after the pump, the time in the ascending triangle has been roughly equal in duration, to the time consolidating after the break to the downside of the triangle, The patterns of each pump have been visually quite similar but with differing timeframes.
Price ranges have been roughly between the 1 and the 1.618 of the previous pump, you can see here that the current price action is currently ranging almost exactly between the 1 and the 1.618 of the previous price range.
Alt coin market tends to be down at the beginning of the pattern and top out after the last high of each triangle. So if you are trading alts, for the most part waiting until bitcoin has finished forming its triangle has been a good selling time. If you are holding alts during the pump you have probably missed the chance to sell and are enjoying some pain right now!
Price predictions going forward
As with all trading, patterns don't hold forever, they work until they don't work however I was about to predict in advance the current high and range by looking at the previous moves, until we break unexpectedly to the upside of one of these triangles i expect bitcoin to keep moving in this "two up then one down" pattern
Why is this happening?
My thought on this is , post halving is inherently bullish, but people are still irrational traders if you take this daily time frame you can see whats going on but on the hourly or less most of whats happening is people getting chopped up, simply put its a way of maximizing pain for the average trader.
Thanks for reading and happy trading
Shameless plugs!
Geocash
I'm using GeoCash! Download it here: downloads.geodb.com and use my referral code: DRLOVELYMAN_SZPZPX to get some free GEOs!
Coinbase earns


