
Bitcoin is in a Descending Triangle, but that is actually a bullish pattern
Bitcoin has been flagging for some time now, about 3 months to be precise.
During that process it has been seeing lower highs and lows that have pretty much stayed the same.
The price action resulting in something that looks a lot like a descending triangle:
https://i.postimg.cc/nhnv7TK9/038466a651aee930b1f72087f805dcbb.png
(Source: https://cointelegraph.com/news/no-bitcoin-price-is-not-in-a-2018-like-descending-triangle-of-doom)
A lot of chartists would say that is a bearish pattern, evidenced by the lower highs.
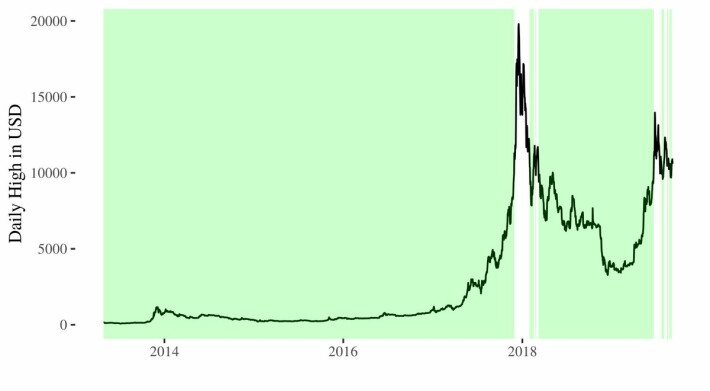
To further back their beliefs, they will point to what happened in late 2018, where bitcoin created a descending triangle for much of the second half of the year, only to see it break to the downside with a massive washout.
That plunge ended up putting in the lows (around $3k) before bitcoin eventually rounded out a bottom and worked its way back up.
Why do I say this is a bullish pattern then?
Well, it's pretty simple actually, that's what the facts support.
According to Bulkowski (the undisputed authority on chart patterns), **descending triangles break up 53% of the time.**
If this descending triangle pattern forms during an overall uptrend (like we have now) the **odds of breaking out to the upside go to 63%!**
(Source: http://thepatternsite.com/)
That means there is only a 37% chance that prices break down from here.
Not sure about you, but that sounds like the odds are on our side for a continued move higher!
Stay informed my friends.
-Doc


