
Hi Everyone,
VeChain (VET)
For the first time in crypto I decided to take a risk with my holding position. In general I do not touch my Hodl positions for the next couple of years, but with VeChain I decided to take a risk. My question was how to increase my VeChain (VET) holding without investing more money ? If I sell my holding and price drops, I will be able to gain more VET in the process of buying it in again. At any point in time if it is lower than the actual selling price I sold it for, I will be able to increase it. This seemed rather interesting as a thought so I decided to do it !
My average buy-in price for VET was around 0,0056$. When price exploded towards the 0,02$ range I started wondering if I should sell it and try to buy lower or just Hodl on. While I was looking at the charts for VeChain I saw it was overbought heavily and the RSI was already pointing downwards on the weekly chart. Furthermore I looked at a lot of other Altcoin charts and most of them were heavily overbought. For me it seemed clear we were going to see some form of correction. I decided to sell all of my VET holdings around 0,0187$ and wait for lower prices. I checked the price every single day in the last couple of weeks, trying to figure out what was going on. Price has been moving from 0,014 to right now around 0,02$. I have been sprinkling buys all around the 0,017/0,016/0,015 and 0,014 levels. This has turned out pretty nicely, because right now I am already above my last total holding amount of VeChain and I still have some Tether left to buy in more ! Right now price is close to 0,02$ so I am going to wait and see what will happen now. 0,02$ can become a double top or we are going to smash through it. I believe it is going to depend on Bitcoin. If Bitcoin is going to smash through 12K I believe VeChain could smash through the 0,02$ as well. If Bitcoin gets rejected, I expect some more downfall for VET. Either way I am happy because I already increased my holdings slightly. If it moves up I can still buy in some more and I will have increased it some more and if price is going to move further down, I will be able to get even more holdings of VET.
All in all it was a funny experience, but I did have days where I felt some FOMO and a little bit of stress when it went up like 8%. IF you have the stomach and are willing to take a risk, you can try it, but otherwise it would be wiser to just HODL. Right now my holdings went up with 5%, but I still have Tether left so I expect in the end to be in between 10% and 20% increase.
Bitcoin (BTC) update
Bitcoin is holding on better than I expected in between 11K and 12K. In my last post I showed some signs to be cautious if you were trading Bitcoin. The Bitmex funding rate was highly favoring going short and the fear and greed index was showing extreme greed. Furthermore there were some signs of overbuying, so I decided to be cautious.
Right now we are seeing the following on the daily chart:
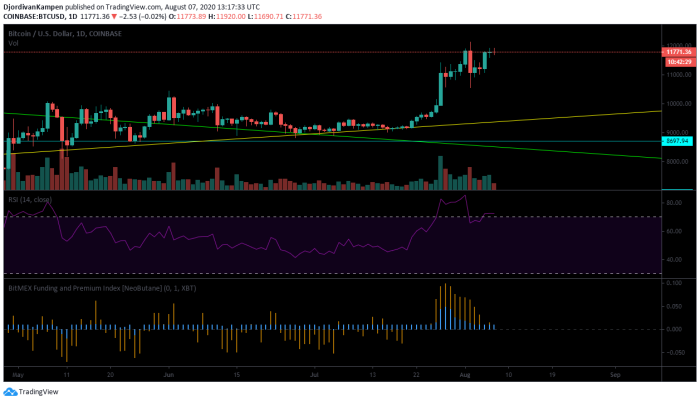
The Bitmex funding rate was rising high in the longs which usually means we are going to see a long squeeze (price moving down). This actually happened on the second of August and since then we see the longs moving down nicely. Right now it still favors going short, because more people are long, but it is not distinctive anymore and this is a good sign.
RSI is still overbought but ever so slightly. We can see that right now we are kind of creating a double top (not confirmed of course) and RSI is quite more down already from the last top. This can be seen as a bearish divergence, which should lead to prices moving down a little bit.
Here is a weekly chart of BTC :
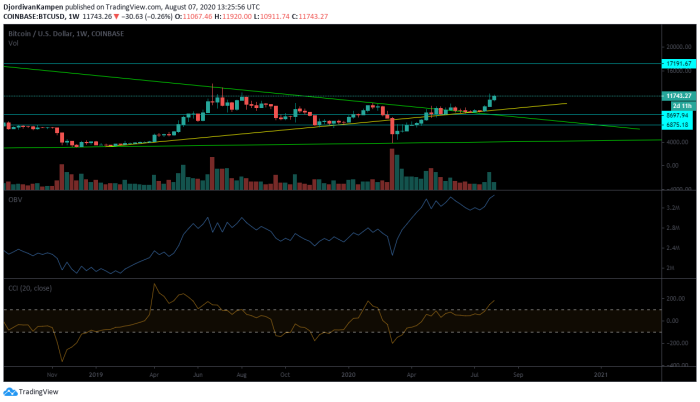
You can see on this chart that OBV (On Balance Volume) has been saving us this week ! We were creating a bearish divergence on the OBV (this is a powerful indicator) with prices rising while OBV was at a lower point, but it has been catching up very nicely ! This is important for me to see that a potential downside move does not have to be all that violent. OBV at the moment is higher than its last point but the week is not yet over. It closes on Sunday so we still have to wait, but unless we are dropping way down, I do not foresee any problems with OBV. The OBV on the daily is doing really well as well.
The CCI (Commodity Channel Index) is a powerful tool to check overbought and oversold conditions. You can clearly see that if we hit overbought, prices will move down and if we hit oversold, prices move upwards. Right now we are creating overbought conditions again, so we could well see a correction again. This is a weekly chart so it might take a couple of weeks before playing out.
By the way if we are in a bull market, these indicators can stay overbought for quite some time !
The fear and greed index of Bitcoin is at the moment of writing around 77 which is still extreme greed.
You can see that there are signs of being cautious, but as well signs that would incline a further move upwards. It is hard to judge so a stop-loss for traders is extremely important. I am currently watching if we can break above the 12K level. The area of 12K/11.8K is resistance, especially on the weekly chart. If we can break through this, then there is not all that much left for us to be really starting a bull market. However I still expect us to correct a little bit, or at least moving around for a couple of weeks in the 10.2K/12K range. Hopefully we will not drop below 10K, because it could well mean moving towards 8K and 7K. I do have buy orders down there, but preferably I would like us to hold the 10K level and never visit down again ! When looking at BTC you should also be following the Dollar index, Gold, Silver and the stock markets. The dollar has been moving down quite some lately and a move to the upside for the dollar is expected (is already happening). This could mean that prices in BTC could fall a little compared to the dollar. Gold and Silver have been moving upwards nicely as well, so a correction should be in the cards as well.
Surprise chart
I would like to show something very interesting right now ! The chart I will show you implies that a heavy move is still to come !
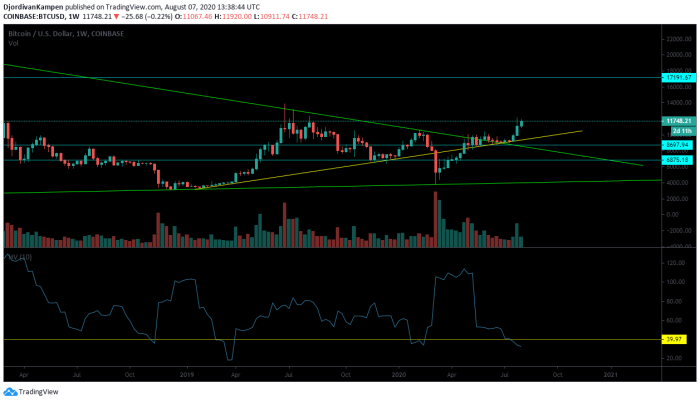
When we look at the HV indicator (Historical volatility) it shows something clearly. Every time we see it go under 40 (I drew at 39,97, but 40 is the same), it implies a heavy move in either direction ! We went from 6K to 3.2K back in 2018. Around April 2019 we went from 3.8K to 14K with the HV indicator under 40 again heavily. We had a big move again in February/March 2020 with the COVID-19 dump to 3.8K and once again the indicator was below 40. Right now we see it again and the funny thing is we went from 9.2K towards 11.8K and the indicator is still moving downwards ! It seems that a big move is still to come if we have to believe this indicator.
Which direction is it going to be ? Let me know in the comment section if you believe we are going upwards or downwards !


