Hi everyone,
I was checking the good old Bitcoin dominance this morning and I decided to share it with you. We will see what this could possibly mean for Altcoins in the next couple of weeks.
Here is a weekly chart of the dominance compared to the Altcoins :
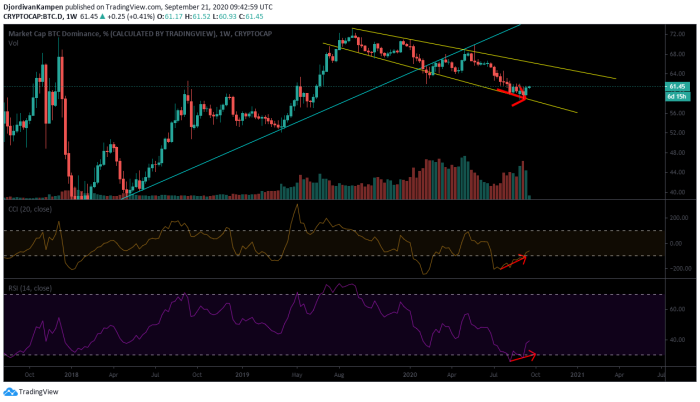
I hope that the chart is clear to see. I have put the indicator CCI (Commodity Channel Index) and the RSI (Relative Strength Index). The red arrows show an interesting picture. There has been bullish divergence for a couple of weeks already on the dominance for Bitcoin and this is not great news for Altcoins. We see a lower dominance on Bitcoin, but the indicators CCI and RSI are moving upwards. This means that the lowering dominance of Bitcoin is losing momentum/strength and that a reversal is likely to happen. It is happening in the last week already.
I wish I would have checked this earlier (my mistake !), because it tells me that Altcoins will likely bleed for the next couple of weeks compared to Bitcoin. If at the same time Bitcoin is going to move downwards, we will see Altcoins bleed hard compared to the Dollar as well. With the right amount of patience you could have waited at least a couple of weeks (starting last week) before deciding to move in your favorite Alts. If you dollar cost average in it is no problem and these next weeks should be a blessing (if you have funds ready to allocate of course). For trading it will be better to wait out a little and try to spot bullish divergences on Alts compared to the Dollar, while looking at charts like the 4-hour or the daily.
I have drawn a blue line that seems important in the dominance, but the candles are far off it, so we do not have to look at this one for a while. The yellow channel is interesting to watch right now, because if Bitcoin continues its strength compared to the Altcoins, we can see it moving all the way towards the top of the yellow channel, which will be around the 65,72% dominance give or take if it were to hit in one month time.
We have had a very big and beautiful run on Altcoins and right now we are seeing the ramifications, because they are retracing quite nicely.
Chainlink (LINK)
Here is a daily chart of Chainlink :

Chainlink is battling right now the 0,786 retracement level on Fibonacci. Hopefully it can hold this because it is already quite a big retracement ! I have had buy-orders ready around the 8,75$ level and it has hit it already this morning. The CCI is oversold and the RSI is very close to getting oversold, so it seems that we are getting closer to a bottom. However looking at Alts right now, I would not be surprised if Chainlink will fall further down towards the 7$ area. This will once again allow me to dollar cost average further in. I see LINK having a great future in the years to come and I do not look at the FUD that is being created around it. When I look at a weekly chart with OBV (On Balance Volume) I see that Chainlink is where it is supposed to be now in terms of OBV and price. It has been running very hot towards 20$ and that was a huge move. A big retracement is necessary and only healthy.
AAVE (ETHLend)
AAVE is another one I want to show. Here is a daily chart :

We are heaving a dumpy day today (so far) and AAVE is going down hard as well. On the daily chart we can see the red line that is holding price right now. Hopefully it will hold and will create a bounce. Looking at the OBV it is absolutely amazing. It is not moving at all since the high in price, which means a lot of weak hands are being shaken-out ! The CCI and the RSI right now are showing a small hidden bullish divergence, but it depends how today will end. If price recovers some, we will likely not see the hidden bullish divergence. If price remains here we will see it. If price were to fall below 0,427$ it will no longer be valid.
I have started to look at AAVE again after my big mistake of selling it a long while ago for a loss around the 0,01$ level. I have learned from my mistake and looking at the On Balance Volume on the daily and the weekly for this Altcoin, it seems to be destined for great gains in the years to come. I have had my first bids hit around the 0,50$ level (around the bottom red line) and around the 0,618 retracement level (Fibonacci). I am ready to buy in more if it were to fall lower. I am going to watch the 0,353$ level area like a hawk if it were to drop below the 0,427$ level (low on the 3rd of September 2020).
Conclusion
Altcoins are looking shaky compared to Bitcoin right now. Bitcoin dominance is moving upwards after a bullish divergence and it seems likely we will see some further gains in dominance for BTC over the next few weeks. If Bitcoin is going to move lower compared to the Dollar we will see Alts bleed harder than BTC. If Bitcoin is going to move up, we will see Alts move upwards as well, but in average it will be less heavy than Bitcoin in my opinion.
Chainlink is battling the 0,786 retracement level (Fibonacci) right now which is quite a retracement already and AAVE is battling the 0,618 retracement level. It seems that important days are coming up, not only for LINK and AAVE. If we bounce from here, it would be very valid and bullish. If we were to break down, watch for a 0,353$ price for AAVE (0,786 retracement) and a 7$ price for LINK.
I believe that right now is an interesting area to buy in some Altcoins if you are dollar cost averaging in. My buy-orders have been hit and I am happy with it. I am going to put some more buy-orders for LINK (7$ area), AAVE (0,353$ area) and some other ones like DOT (Polkadot), VeChain (VET) and of course Bitcoin.
This is not financial Advice and I am not a financial adviser. Please do your own research and make your own decisions !


