
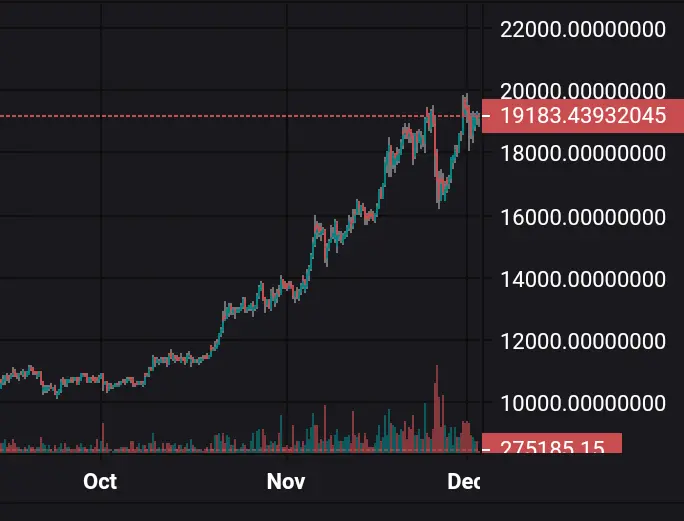
Chart 1: Price chart from October to December
Since the beginning of the current bullish trend, BTC has shown to be the number one most utilized token in the world.
The price started getting better from October as some good investors invested in it and regulations were made to be fair to its users and gas fees increased.
Today, BTC is the talk of the day as it fights to go beyond $20,000.
We saw BTC some days ago almost at 20k but was slashed by some scared investors due to the panic raised by the regulators and enforcement agencies.
 Chart 2: Panic days
Below are some other charts and tables showing volumes and price increments from 2dn October to 3rd December.
 Chart 3: Prices from 2dn October to 3rd December
On 2nd October, BTC got pumped which spiked the price from $10648 till what we have now.
Before then, BTC was seen to be lingering, less utilized and doubted to have a future.
 Table 1: volume of trade on 2nd October
Table 1 shows the high-low, open-close and volume of sales in 24 hours which was about 3.8 million dollars. This is nothing to be compared with what we have today or few days ago.
After the panic which drew BTC from 19k+ down to about $16,775, we began to see another come back made by BTC as some of those who ran away, coming back to make their boast.
Today, we have BTC traded at high price, high gas fees and we expect it to move above $20k before weekend.
 Chart 4: This month's trades
In the past days, today's is one of the most outstanding days as more trades are made.
We currently have over 24 million dollar trades and we're still counting. Table 2: Currently table of trades
My question today is, will BTC move beyond $20k dollars or still lingering around $19k?






