
Investment Disclaimer:
- I am not a registered investment, legal, or tax adviser or a broker/dealer, and all opinions expressed by me are from my research for educational purposes only.
- Past performance presented here is not an indicator of future performance.
- This post expresses my own opinion about the cryptocurrency mentioned herein and is not an offer to buy or sell, or a solicitation of any offer to buy or sell the cryptocurrency mentioned in this post.
1. How Binance Coin Performs Relative to Other Cryptos ?

As of 29 March 2021, Binance Coin has made a cumulative return of 1944.65% since Jan 2020 and 706.2% since Jan 2021. It is currently the 2nd greatest performing crypto asset since Jan 2021 as compared to the other cryptocurrencies presented above.
2. Technical Analysis on Binance Coin
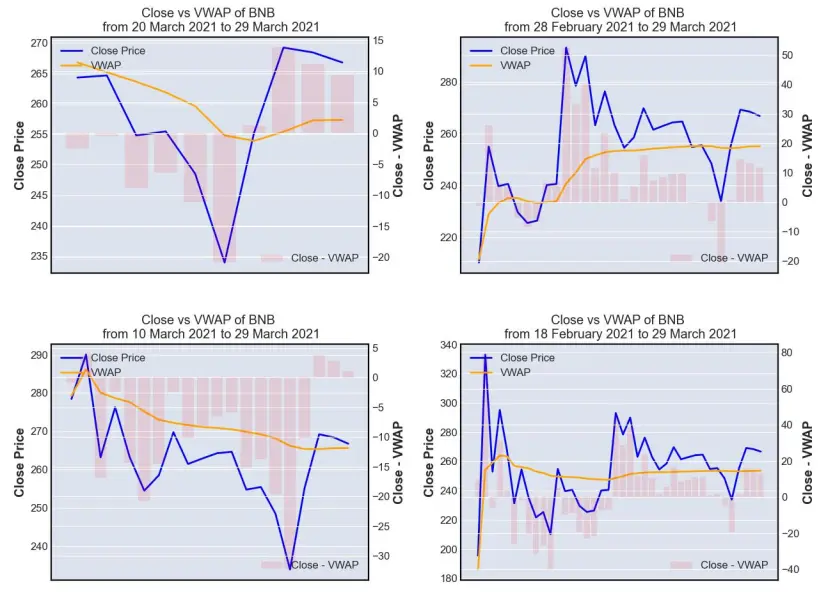
2.1. Volume Weighted Average Price (VWAP)
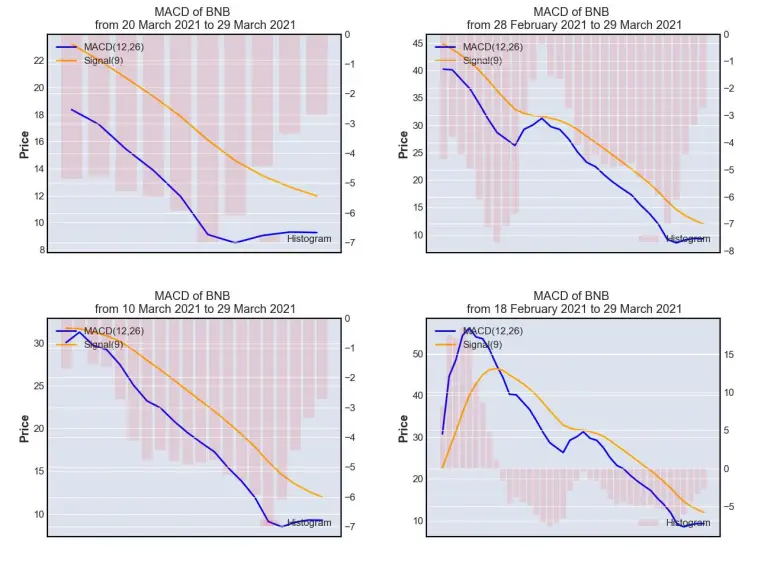
2.2. Moving Average Convergence Divergence (MACD)
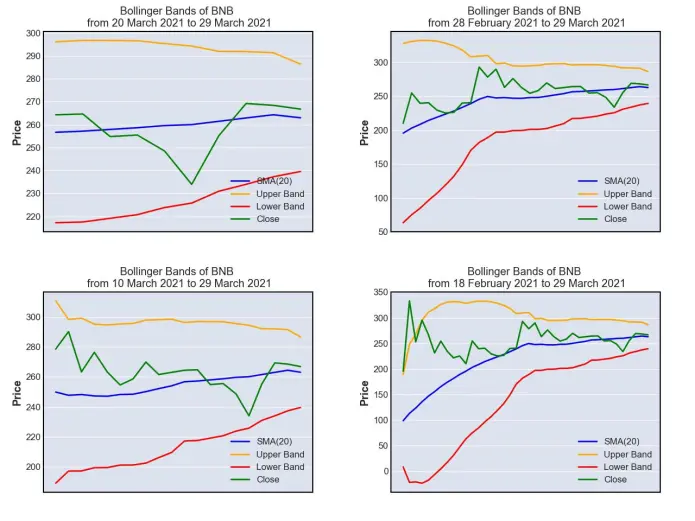
2.3. Bollinger Band
2.4. Relative Strength Index (RSI)
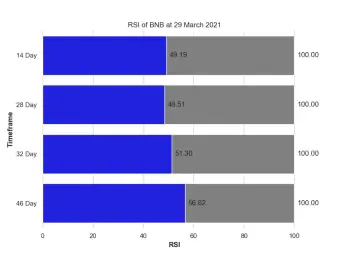
Based on the technical analysis presented above, quantdoge has taken a neutral stance on the short-term price outlook of Binance Coin.
3. Binance Coin Risk Profile


Based on the 100-day 95% historical Value-at-Risk (VaR) profile of Binance Coin defined above, there is a 5% probability that Binance Coin could lose more than 4.17% of its current value in any single trading day with its worst pullback being recorded at 27.51% on a single day during the last 100 days. Binance Coin is becoming riskier on 29 Mar 2021 as compared to 10 days before on 20 Mar 2021.
If you are into Bitcoin (BTC) and Ethereum (ETH), I have made a similar analysis on this yesterday at:
If you like my analysis and articles, please follow me at @quantdoge for daily updates.






