
Investment Disclaimer:
- I am not a registered investment, legal, or tax adviser or a broker/dealer, and all opinions expressed by me are from my research for educational purposes only.
- Past performance presented here is not an indicator of future performance.
- This post expresses my own opinion about the cryptocurrency mentioned herein and is not an offer to buy or sell, or a solicitation of any offer to buy or sell the cryptocurrency mentioned in this post
1. Top 3 Good News for VET HODLERS !!!
-
The moment is here! We are pleased to announce DHL has chosen the #VeChainThor blockchain for their NFT collectio…
Statistic as of 2021-10-27 10:11 AM EDT: 69 positive votes, 1 negative vote -
VeChain Foundation Announces Vote To Implement Upgrade, Bullish For VET?
Statistic as of 2021-10-27 10:11 AM EDT: 63 positive votes, 1 negative vote
Via their Twitter handle, the VeChain Foundation announced the start of the voting process that will allow the community to decide to implement or reject a major update to their network: Proof-of-Authority (PoA) 2.0. This upgrade could usher a new wave of blockchain “mass adoption”, the announcement said. As NewsBTC reported, the PoA 2.0 upgrade will eliminate the tradeoffs of the Nakamoto...
(Extracted from CryptoPanic) -
This VeChain Partnership Will Enable VET Holders To Buy On Ebay, Amazon And Others
Statistic as of 2021-10-27 10:11 AM EDT: 32 positive votes, 0 negative vote
The VeChain Foundation has announced a partnership with Shopping.io, an e-commerce platform of international scope that has been integrating crypto payments. From today July 9th, consumers can use VET tokens to purchase at Amazon, eBay, Walmart, and Etsy. In addition, VET holders can benefit from a 2% discount on all items, from electronics, novelty, everyday […]
(Extracted from CryptoPanic)
2. How Vechain Performs Relative to Other Cryptos ?
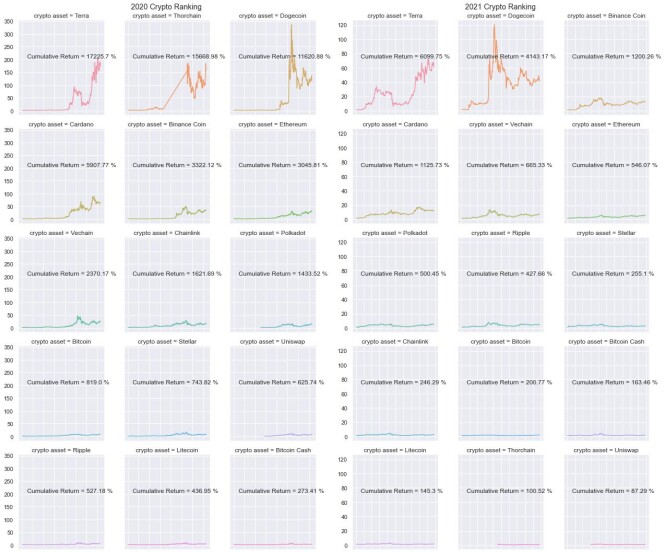
As of 26 Oct 2021, Vechain has made a cumulative return of 2370.17% since Jan 2020 and 665.33% since Jan 2021. It is currently the 5th greatest performing crypto asset since Jan 2021 as compared to the other cryptocurrencies presented above.
3. Technical Analysis on Vechain
3.1. Volume Weighted Average Price (VWAP)

VWAP is a technical indicator used by a trader to gauge the overall trend of an asset price movement. VWAP line (orange line) represents the volume-weighted average price (average price here is defined as the average of high, low and close prices) while close price line (blue line) represents the price when VET is closed at the end of every single day.
Whenever blue line (close price) is above orange line (VWAP), it indicates that the asset is gaining momentum and being traded higher than its average price level. This would represent a 'buy' opportunity for short-term momentum trader whom task is to trade following the trend while a longer term mean-revision trader might take it as a 'sell' opportunity, anticipating that the price of VET (blue line) to fall to its average level (orange line).
Whenever blue line (close price) is below orange line (VWAP), it indicates that the asset is losing momentum and being traded lower than its average price level. This would represent a 'sell' opportunity for short-term momentum trader whom task is to trade following the trend while a longer term mean-revision trader might take it as a 'buy' opportunity, anticipating that the price of VET (blue line) to rise to its average level (orange line).
As of 26 Oct 2021, VWAP is suggesting that VET has starting to lose momentum from its peak 2 days ago.
3.2. Moving Average Convergence Divergence (MACD)

MACD is often used by trader as a momentum indicator. There are 2 lines that form the above charts, namely MACD (12, 26) lines and Signal(9) line, while the histogram is calculated by subtracting Signal (9) from MACD (12,26). Histogram would fall to the negative territory whenever MACD (12, 26) is trending at a lower level than Signal (9) and rise to the positive territory whenever MACD (12,26) is trending at a higher level than Signal (9).
MACD (12, 26) is computed by subtracting the 26-day exponential moving average (EMA) of VET closing price from its 12-day EMA.
Signal (9) on the other hand is calculated as the 9-day EMA of MACD (12,26).
As MACD (12, 26) goes higher away from Signal (9), it signifies that VET is gaining momentum and whenever it goes trends at a lower level than Signal (9),it signifies that VET is losing momentum.
As of 26 Oct 2021, MACD is suggesting that VET is gaining a strong upward momentum.
3.3. Bollinger Band
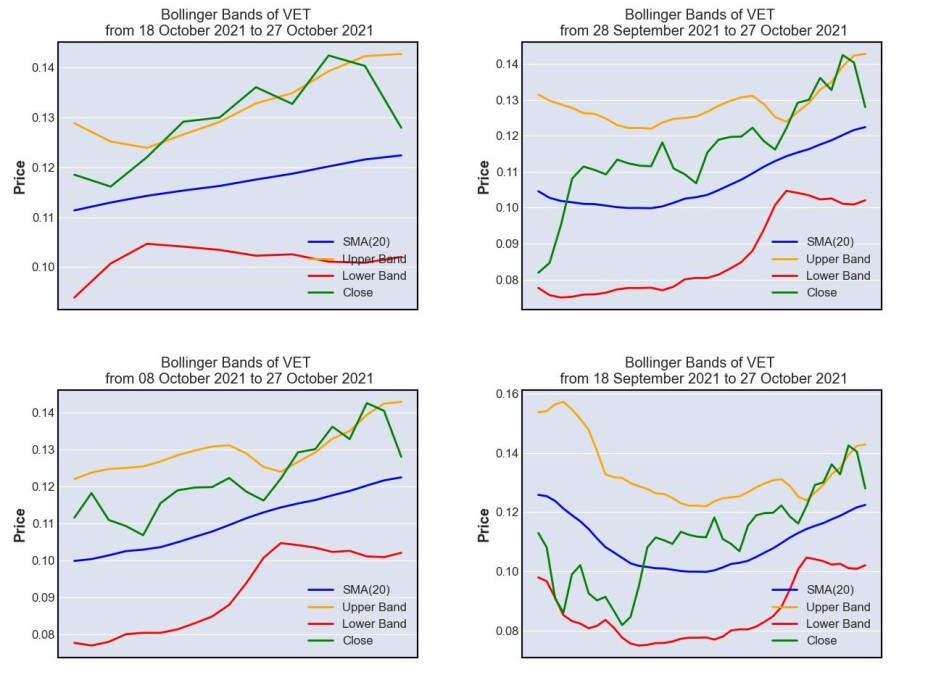
Bollinger band is often being used by mean-reversion trader as a gauge to assess how undervalued or overvalued an asset is. Its chart made up of 4 lines, namely:
- SMA (20) (blue line), which is the 20-day simple moving average price of VET
- Upper Band (orange line), which is computed by adding 2 standard deviations of VET on SMA (20)
- Lower Band (red line) , which is computed by subtracting 2 standard deviations of VET from SMA (20)
- Close (green line), which is the daily closing price of VET
Whenever close line (green) touches the lower band (red), it indicates that VET is corrected too much and is being traded at an undervalued level, representing a 'buy' opportunity. On the other hand, whenever close line (green) touches the upper band (orange), it indicates that VET is gaining too much momentum and is being traded at an overvalued level, thus indicating a 'sell' opportunity.
As of 26 Oct 2021, Bollinger Band is suggesting that VET is fairly valued.
3.4. Relative Strength Index (RSI)
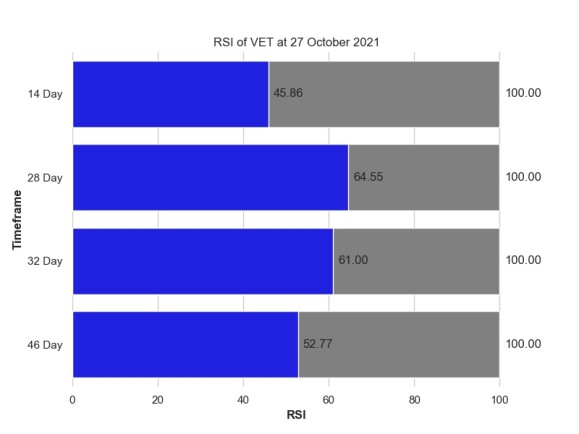
Just like Bollinger Band, Relative Strength Index is often being used by mean-reversion trader as a gauge to assess how undervalued or overvalued an asset is. There are 2 psychological levels, i.e. 30 and 70 in RSI. Whenever the RSI reaches 30, it indicates that VET is corrected too much and is being traded at an undervalued level, representing a 'buy' opportunity. On the other hand, whenever RSI reaches 70, it indicates that VET is gaining too much momentum and is being traded at an overvalued level, thus indicating a 'sell' opportunity.
As of 26 Oct 2021, RSI is suggesting that VET is trading near its fair value level.
Based on the technical analysis presented above, Quantdoge holds a slight bullish view on VET in the near term, but I could be wrong, hence please make your careful due diligence before making any financial decision.
4. Vechain Risk Profile
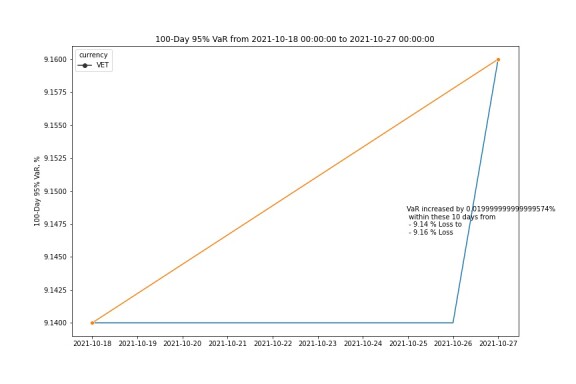

Based on the 100-day 95% historical Value-at-Risk (VaR) profile of Vechain defined above, VET seems to trade at a similar risk level on 26 Oct 2021 as compared to 10 days before on 16 Oct 2021, with its biggest pullback being seen at [MANUAL COMMENT] on a single day during the last 100 days. However, I could be wrong, hence please make your careful due diligence before making any financial decision.
5. Price Simulation for Vechain
How did quantdoge simulation perform vs the actual VET price movement over the last week ?
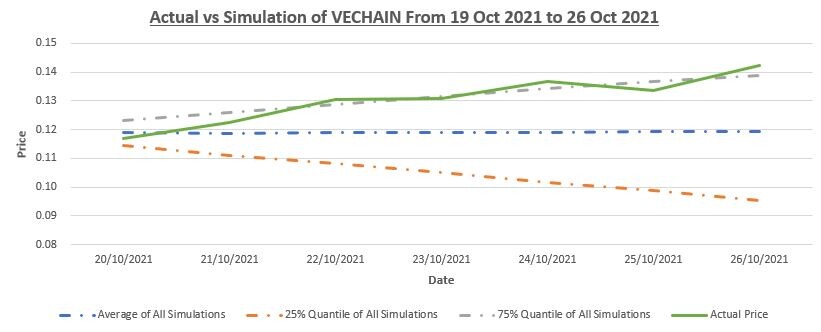
Over the last 7 days, VET has been trading at the higher price range of quantdoge simulations, indicating that VET was slightly overbought.
6. VET Community Analytics
Number of VET Followers In The Past 24 Months
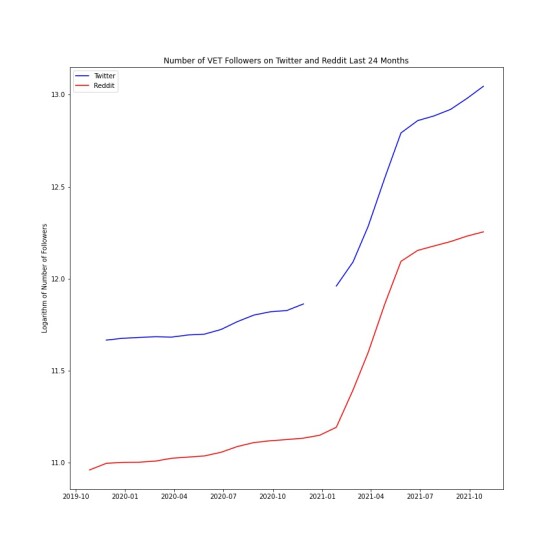
During the past 24 months, Vechain followers have grown 264.56 % from 57,603 to 209,998 on Reddit.
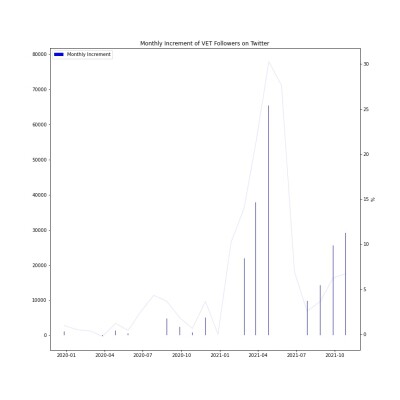

Monthly increment of Vechain Twitter followers peaked on May 2021 and its monthly increment of Reddit followers peaked on May 2021.
Number of VET Followers In The Last 30 Days
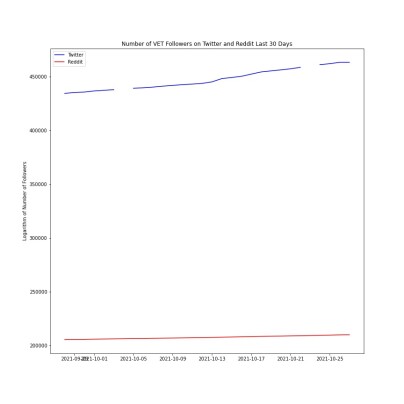
In the last 30 days alone, Vechain followers have grown 6.64 % from 434,388.0 to 463,241.0 on Twitter and grown 2.22 % from 205,435 to 209,998 on Reddit.
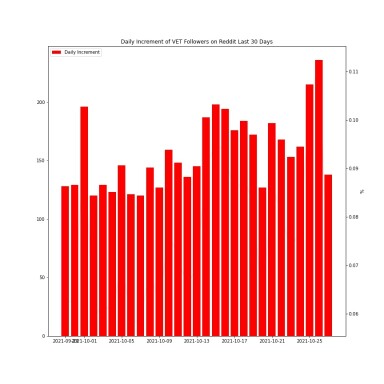

Daily increment of Vechain Twitter followers peaked on 14 Oct 2021 and its daily increment of Reddit followers peaked on 26 Oct 2021.
If you like my analysis and articles, please follow me at @quantdoge for daily updates.


