
Investment Disclaimer:
- I am not a registered investment, legal, or tax adviser or a broker/dealer, and all opinions expressed by me are from my research for educational purposes only.
- Past performance presented here is not an indicator of future performance.
- This post expresses my own opinion about the cryptocurrency mentioned herein and is not an offer to buy or sell, or a solicitation of any offer to buy or sell the cryptocurrency mentioned in this post.
- I do hold a long position in NEAR as a token holder.
1. What Is Near Protocol ?
1.1. Introduction to Near Protocol
Near Protocol is a high throughput sharded smart contract based blockchain that runs on delegated proof-of-stake consensus. It has a block time of 1 second on average and could process up to 100,000 transactions per second.
1.2. Founders and Backers
Near Protocol was founded by 2 Silicon Valley bright minds, Alexander Skidanov who was former Microsoft software engineer and Illia Polosukhin who was former Engineering Manager at Google. Near Protocol is backed by many well-known and established venture capitals, some of the big names are Andreessen Horowitz, Coinbase Ventures and Baidu Ventures.
1.3. Unique Features of Near Protocol
Near Protocol operates on smart-contract-based account model where each account is a smart contract and each account also came with a human-readable address, which we usually have to pay for it with services like Ethereum Name Service (.eth) for other layer 1 blockchains.
In addition, Near Protocol also offers a community contribution program called Guild, which consists of many decentralized communities where each community works on specific proposals/ projects that would help Near ecosystem according to their specific skill set. Near team has set aside budget from their treasury to incentivize and reward Guild which has contributed meaningfully to Near.
Near Protocol also came with a layer 2 scaling solution called Aurora, which has Ethereum Virtual Machine (EVM) compatibility that allows Ethereum developer to easily port their projects to Near as easy as just changing the RPC endpoint.
1.4. Tokenomics
Details: https://near.org/blog/near-token-supply-and-distribution/
There were 2 phases of Near MainNet Launches,
MainNet Restricted ("Phase 1"):
This is a phase where token holders were restricted from directly transferring tokens (but they could still be used to pay for gas or storage, staked, delegated, used to deploy apps, etc)
Community-Governed MainNet ("Phase 2"):
At this phase, tokens can now be transferred as the main net is now unrestricted and decentralized.
At this time of writing, Near has entered into Phase 2 officially on 13 Oct 2020.
There is a total maximum supply of 1 billion Near tokens at genesis (also known as Genesis Tokens). Genesis tokens were allocated on an ongoing basis to individuals and organizations during the rollout of Phase 2 Main Net. The vast majority of tokens are subject to linearly releasing lockups where the tokens held by Near early backers and holders can only be sold after this lockup being released. All lockup periods will be counted from the day of Near main net launch and the lockup release schedule is as followed:
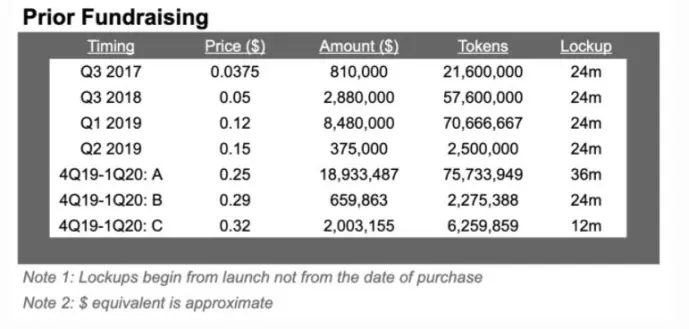
Care should be taken on these key dates as there is a high chance for Near early-stage venture capitalists to cash out the tokens for profits on these lockup release dates, and a high sales volume would depress Near token price nearing these dates.
Besides, Near token is also inflationary in nature where there is a 5% additional token supply every year. 90% of these supplied tokens would be distributed to Near validators for dedicating their resources to secure the Near network while the remaining 10% would be kept in treasury.
Despite the 5% inflation rate, 30% of transaction fees are rebated to the contracts touched by the transaction and 70% are burned. Due to this burning mechanism, at high levels of transaction throughput the network could become deflationary.
2. How Near Performs Relative to Other Cryptos ?
Performance of All Cryptos Under Quantdoge Watchlist since 2021 (Sorted by % Return)
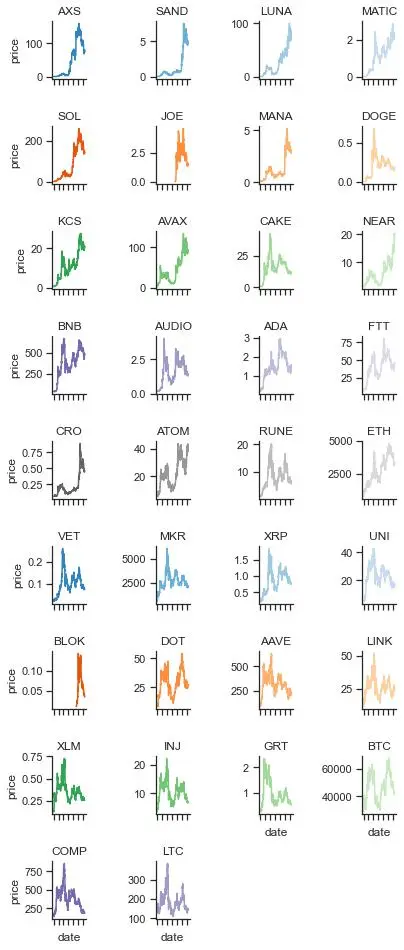
NEAR has undergone 1,208.84% return from USD 1.354 to USD 17.7217 since 01 Jan 2021. NEAR is the 12th best performing crypto assets among others here.
3. How Resilience Near Is Towards Bitcoin Crash Relative to Other Cryptos ?
Historically, all altcoins are somewhat dependent on Bitcoin price movement and it’s often the case where if Bitcoin falls, most altcoins would follow.
Top 3 Cryptos That Are Most Resilient To Bitcoin Crash During Each of BTC 4 Largest Crashes in 2021
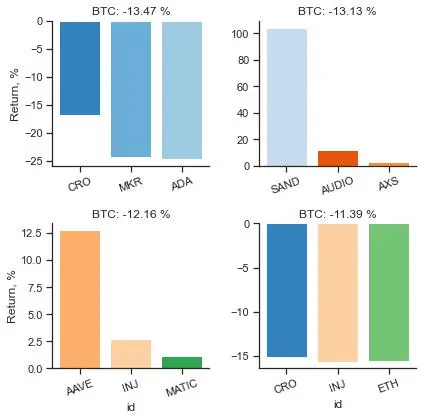
NEAR has proven resilience against BTC crash in 0 out of the 4 instances.
During the last 4 BTC market crashes,
When BTC dropped by -13.47 %, NEAR returned -35.85 % at 20 May 2021,
When BTC dropped by -13.13 %, NEAR returned -12.66 % at 22 January 2021,
When BTC dropped by -12.16 %, NEAR returned 0.1 % at 13 May 2021,
When BTC dropped by -11.39 %, NEAR returned -21.61 % at 22 June 2021
4. Technical Analysis on Near
4.1. Volume Weighted Average Price (VWAP)
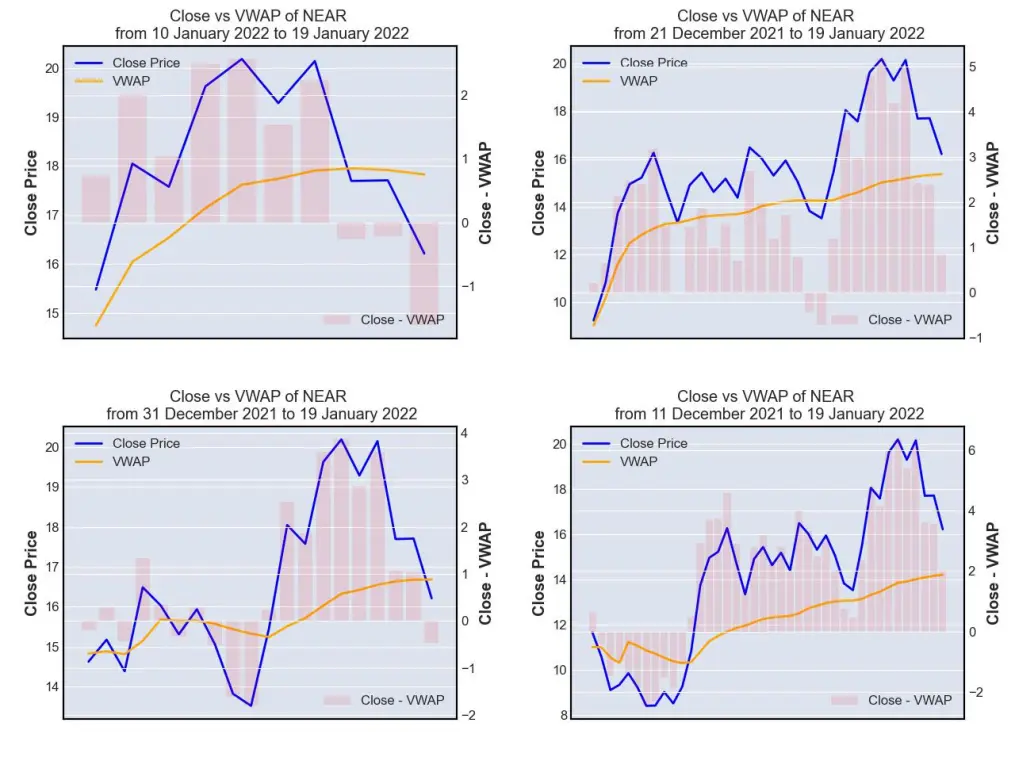
VWAP is a technical indicator used by a trader to gauge the overall trend of an asset price movement. VWAP line (orange line) represents the volume-weighted average price (average price here is defined as the average of high, low and close prices) while close price line (blue line) represents the price when NEAR is closed at the end of every single day.
Whenever blue line (close price) is above orange line (VWAP), it indicates that the asset is gaining momentum and being traded higher than its average price level. This would represent a 'buy' opportunity for short-term momentum trader whom task is to trade following the trend while a longer term mean-revision trader might take it as a 'sell' opportunity, anticipating that the price of NEAR (blue line) to fall to its average level (orange line).
Whenever blue line (close price) is below orange line (VWAP), it indicates that the asset is losing momentum and being traded lower than its average price level. This would represent a 'sell' opportunity for short-term momentum trader whom task is to trade following the trend while a longer term mean-revision trader might take it as a 'buy' opportunity, anticipating that the price of NEAR (blue line) to rise to its average level (orange line).
As of 19 Jan 2022, VWAP is suggesting that NEAR is losing momentum. Although its trading below its week-long volume-weighted average, it's still trading above its month-long volume-weighted average price.
4.2. Moving Average Convergence Divergence (MACD)
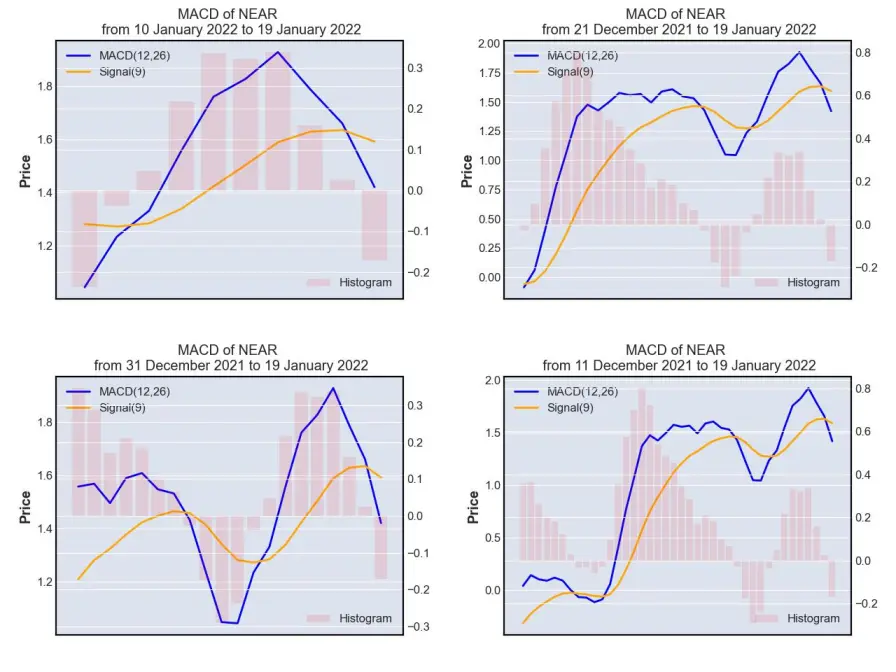
MACD is often used by trader as a momentum indicator. There are 2 lines that form the above charts, namely MACD (12, 26) lines and Signal(9) line, while the histogram is calculated by subtracting Signal (9) from MACD (12,26). Histogram would fall to the negative territory whenever MACD (12, 26) is trending at a lower level than Signal (9) and rise to the positive territory whenever MACD (12,26) is trending at a higher level than Signal (9).
MACD (12, 26) is computed by subtracting the 26-day exponential moving average (EMA) of NEAR closing price from its 12-day EMA.
Signal (9) on the other hand is calculated as the 9-day EMA of MACD (12,26).
As MACD (12, 26) goes higher away from Signal (9), it signifies that NEAR is gaining momentum and whenever it goes trends at a lower level than Signal (9),it signifies that NEAR is losing momentum.
As of 19 Jan 2022, MACD is suggesting that NEAR is losing momentum and is now trading below the signal line.
4.3. Bollinger Band
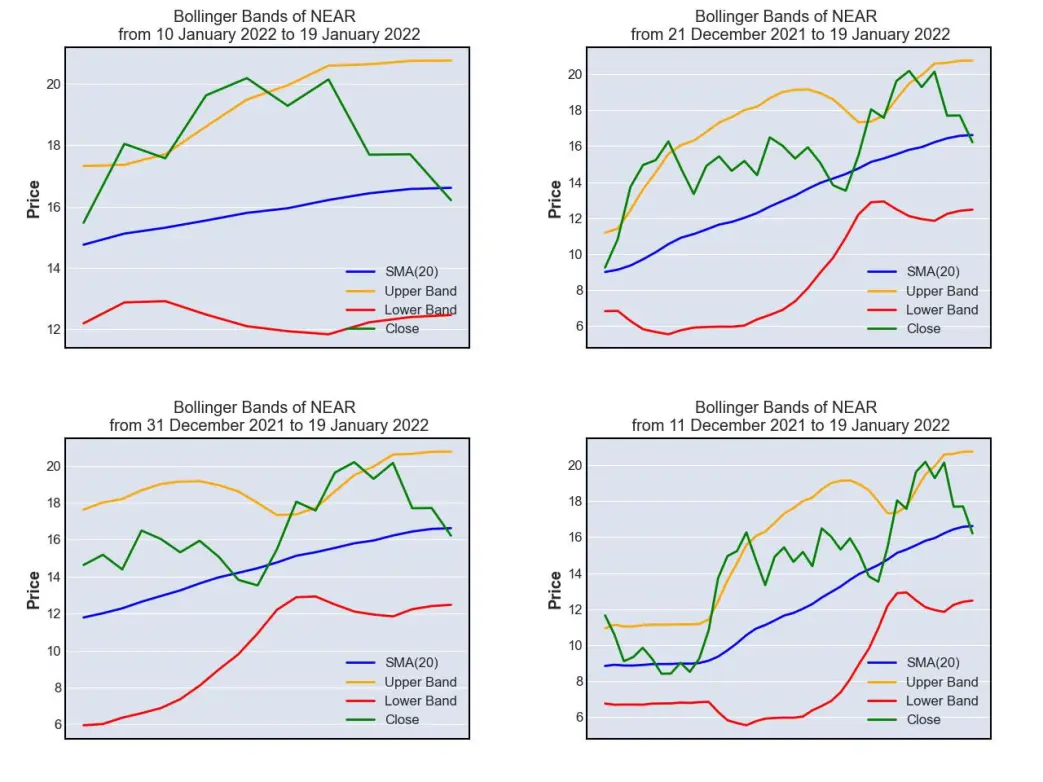
Bollinger band is often being used by mean-reversion trader as a gauge to assess how undervalued or overvalued an asset is. Its chart made up of 4 lines, namely:
- SMA (20) (blue line), which is the 20-day simple moving average price of NEAR
- Upper Band (orange line), which is computed by adding 2 standard deviations of NEAR on SMA (20)
- Lower Band (red line) , which is computed by subtracting 2 standard deviations of NEAR from SMA (20)
- Close (green line), which is the daily closing price of NEAR
Whenever close line (green) touches the lower band (red), it indicates that NEAR is corrected too much and is being traded at an undervalued level, representing a 'buy' opportunity. On the other hand, whenever close line (green) touches the upper band (orange), it indicates that NEAR is gaining too much momentum and is being traded at an overvalued level, thus indicating a 'sell' opportunity.
As of 19 Jan 2022, Bollinger Band is suggesting that NEAR is retracting to its 20-day simple moving average price level, it's neither overbought to an overvalued position nor oversold to an undervalued position.
4.4. Relative Strength Index (RSI)
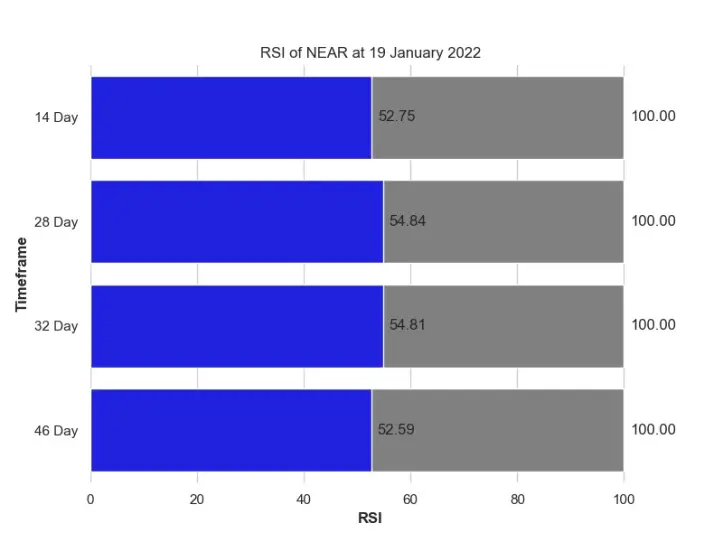
Just like Bollinger Band, Relative Strength Index is often being used by mean-reversion trader as a gauge to assess how undervalued or overvalued an asset is. There are 2 psychological levels, i.e. 30 and 70 in RSI. Whenever the RSI reaches 30, it indicates that NEAR is corrected too much and is being traded at an undervalued level, representing a 'buy' opportunity. On the other hand, whenever RSI reaches 70, it indicates that NEAR is gaining too much momentum and is being traded at an overvalued level, thus indicating a 'sell' opportunity.
As of 19 Jan 2022, RSI is suggesting that NEAR is neither oversold nor overbought.
4.5. Price and Volume Analysis
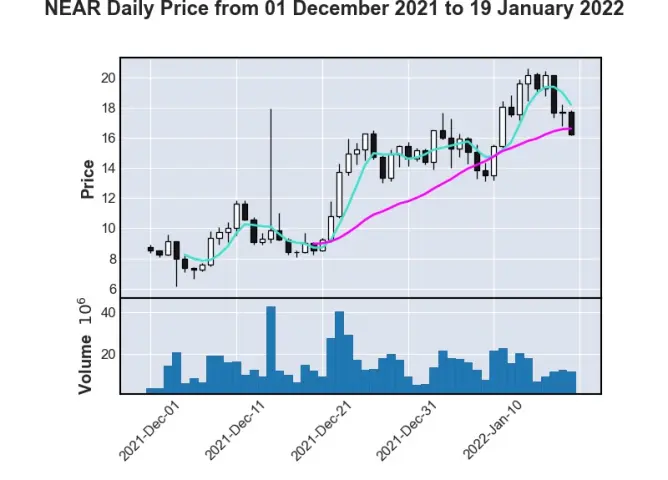
NEAR daily active trading volume in Jan 2022 is less than Dec 2021 on average. NEAR last bull run from 20 Dec 2021 to 24 Dec 2021 was supported by a huge influx of trading volume but its recent bull run was only supported by half of prior year trading volume.
5. NEARUSDT Futures Activities on Binance Futures
Following visuals were built on top of public data extracted from Binance using Binance USD-M Futures API as of 20 Jan 2022 00:20 UTC time.
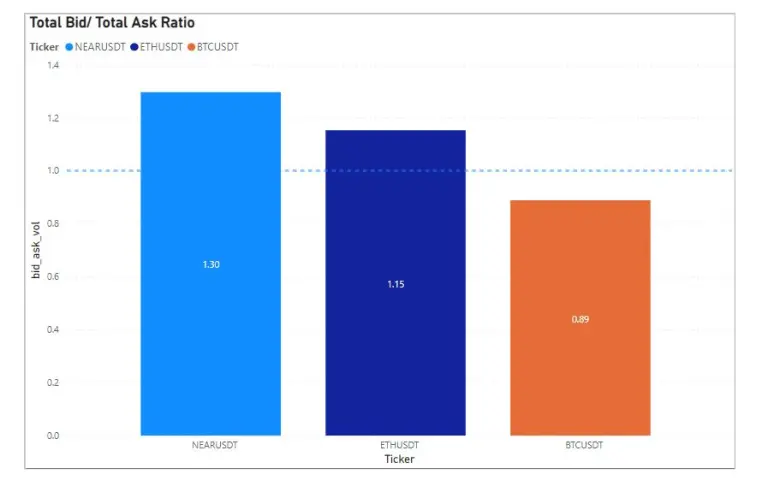
Above ratio was constructed by dividing total bid orders by total ask orders, a ratio of greater than 1 indicates that there are more buyers than sellers while any ratio less than 1 would mean that there are more sellers than buyers. As of 20 Dec 2020 00:20 UTC time, this ratio is the highest for NEARUSDT futures as compared to ETHUSDT and BTCUSDT which often deemed as a safer crypto asset.
The bid/ask ratio of BTCUSDT is below 1.0 while the bid/ask ratio for ETHUSDT and NEARUSDT are above 1.0, this might indicate that crypto users in general are bearish on BTC while bullish on ETH and alts like NEAR.
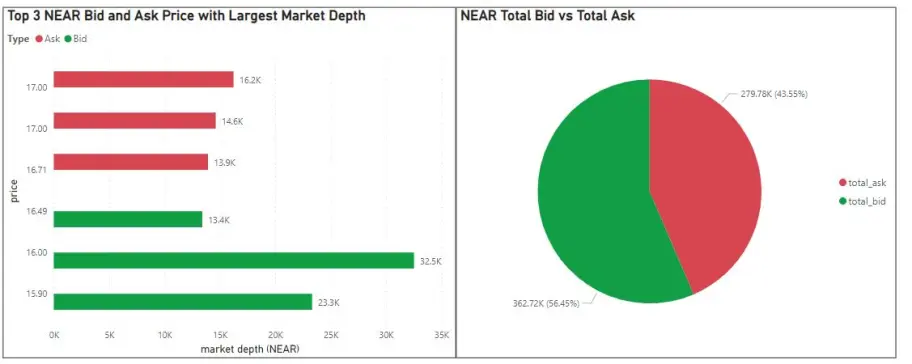
At the time of writing, NEAR is trading at USD 16.45, and there are a lot of buyers placing their orders at USD 16.00, hoping to buy the dip as NEAR price continues to fall. Overall, 56.45% of NEARUSDT futures traders are placing bets on NEAR going up with remaining 43.55% of them taking the opposite short position (i.e. betting that NEAR going down).
Based on the technical analysis and futures activities presented above, quantdoge is neutral on NEAR, but I could be wrong, hence please make your careful due diligence before making any financial decision.
6. Near Risk Profile
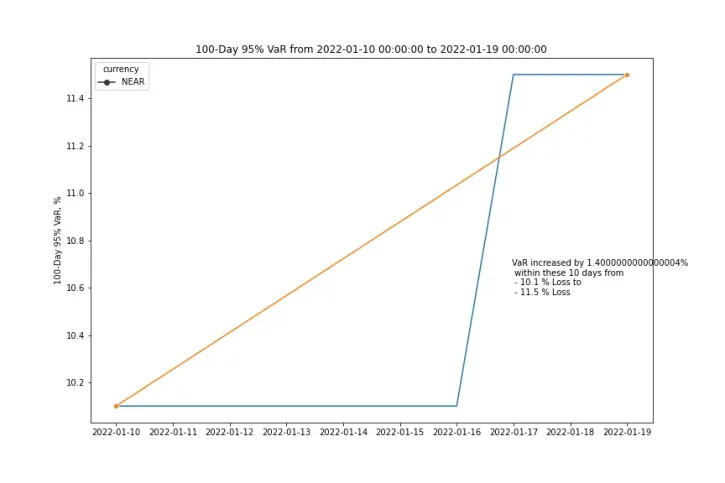
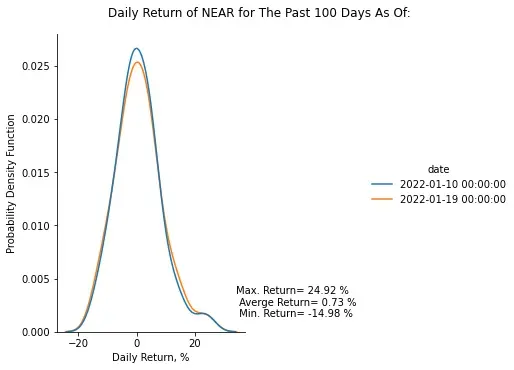
Based on the 100-day 95% historical Value-at-Risk (VaR) profile of Near defined above, NEAR seems to trade at a greater risk level on 19 Jan 2022 as compared to 10 days before on 09 Jan 2022, with its biggest pullback being seen at - 14.98% on a single day during the last 100 days. However, I could be wrong, hence please make your careful due diligence before making any financial decision.
NEAR probability distribution chart indicates that NEAR price action is getting more volatile, with lower probability of trading at 0% stagnant range but with fatter tails (i.e. higher chance of either making more than 20% or losing more than 20%) as compared to 10 days earlier.
7. Google Trends Analytics
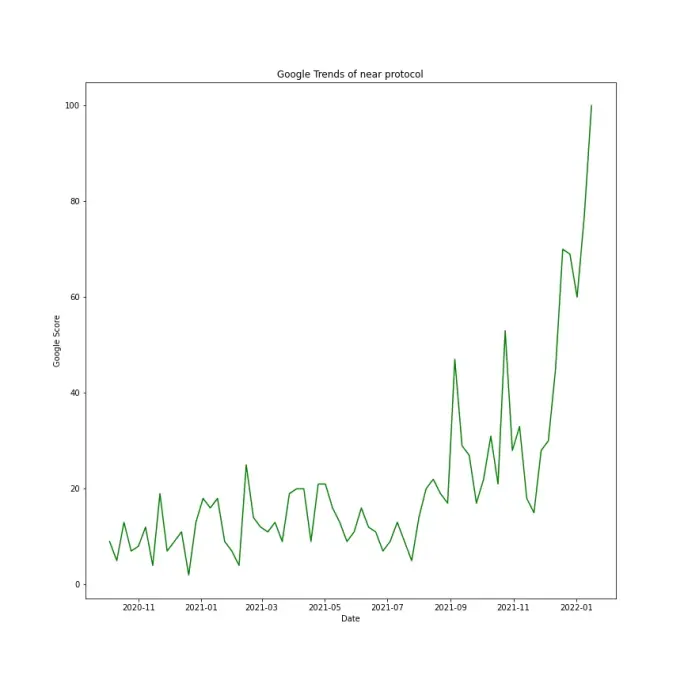
near protocol reached its peak in Google Search on 2022-01-16 with a Google Score of 100
Over the last quarter, near protocol Google Score has increased 236.17 % from 23.5 to 79.0
Over the last 6 months, near protocol Google Score has increased 329.35 % from 18.4 to 79.0
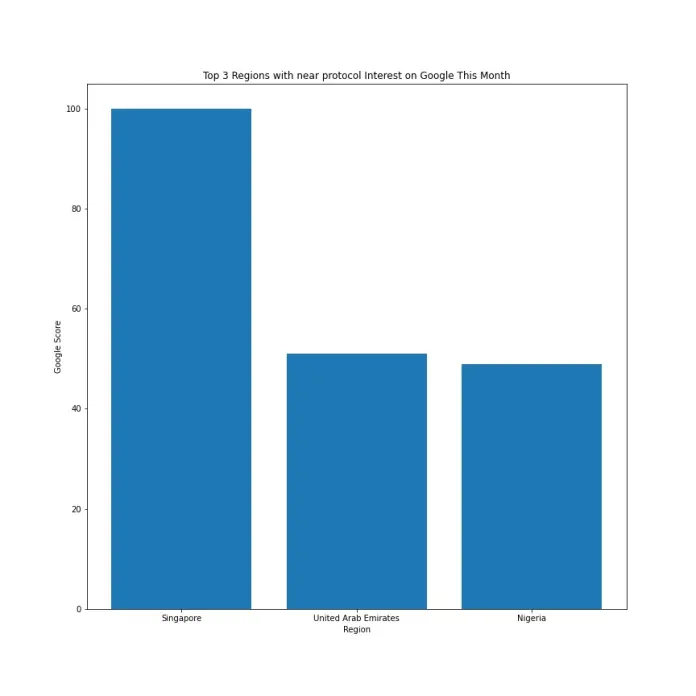
Over the last month, near protocol is most saught after on Google from Singapore, UAE and Nigeria.
Singapore and UAE are crypto-friendly high-income nations which are supportive of crypto ecosystem and welcome crypto startups and crypto venture firms to open shops at their regions. A high interest from these 2 regions are very bullish to NEAR as this would mean that NEAR is getting attention from serious Web 3.0 builders and committed venture capitalists. Nigeria on the other hand has a heavy crypto userbase, hence a high interest of NEAR from their people is a bullish sign.
9. Developer Activity Analytics
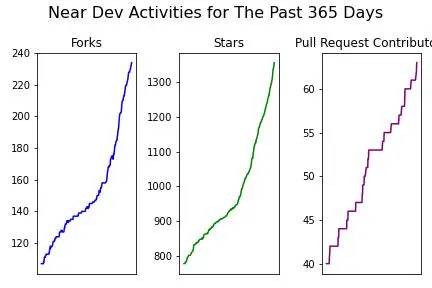
Fork
Fork refers to the amount of time where the Github repo of current cryptocurrency is being copied. Higher fork number could mean that this cryptocurrency project is getting more interest in the developers community who likes to explore more on the deep technical of this project.
Near forks increased 118.69% from 107 to 234 in the past year.
Star
Star refers to the number of developers who bookmark the Github repo of current cryptocurrency. Higher star number could mean that this cryptocurrency project is getting more general interest in the developers community.
Near stars increased 74.29% from 778 to 1,356 in the past year.
Pull Request
Pull request contributor refers to developer who has made a successful improvements/ modifications on the Github repo of this current cryptocurrency project. Higher number of pull request contributors could mean that there is a high number of commitment given by developers to this cryptocurrency project.
However, a low number also could mean that the developer community of this project applies a strict standard when it comes to code review, so only developers who have published a high quality code with highly impactful features got approved.
Near pull request contributors increased 57.5% from 40 to 63 in the past year.
If you like my analysis and articles, please follow me at @quantdoge for daily updates.
Follow My Twitter for daily updates: https://twitter.com/quantdoge





![🚀 The Revolution of Tokenized Stocks: What Are xStocks and Why Do They Change the Game? 🌍💸 [PT/SPA/ENG/GER/KOR]](https://www.publish0x.com/img/1189947.webp?action=resize&ar=1&enc=webp&h=287&inv=0&ori=1&st=1&up=1&w=510&signature=a117a76d4964d2e2bc60f62785c0d23f579158f91f94477b44342b2300162ecb)

