Investment Disclaimer:
- I am not a registered investment, legal, or tax adviser or a broker/dealer, and all opinions expressed by me are from my research for educational purposes only.
- Past performance presented here is not an indicator of future performance.
- This post expresses my own opinion about the cryptocurrency mentioned herein and is not an offer to buy or sell, or a solicitation of any offer to buy or sell the cryptocurrency mentioned in this post.
1. What is Maker Protocol ?
Maker Protocol is a Multi-Collateral Dai (MCD) system which allows users to borrow Dai (a stable coin backed by different collaterals posted onto the Maker protocol). Dai is widely accepted by many DeFi platforms and Centralized Exchanges (CEX) where it could be used to trade, lend, borrow and stake. Maker token (MKR) is used as a governance token for Maker Protocol where members (i.e. token holders) of Maker DAO could vote on various matters that are related to Maker Protocol.
(Read more on https://makerdao.com/en/whitepaper#abstract )
2. How Maker Performs Relative to Other Cryptos ?
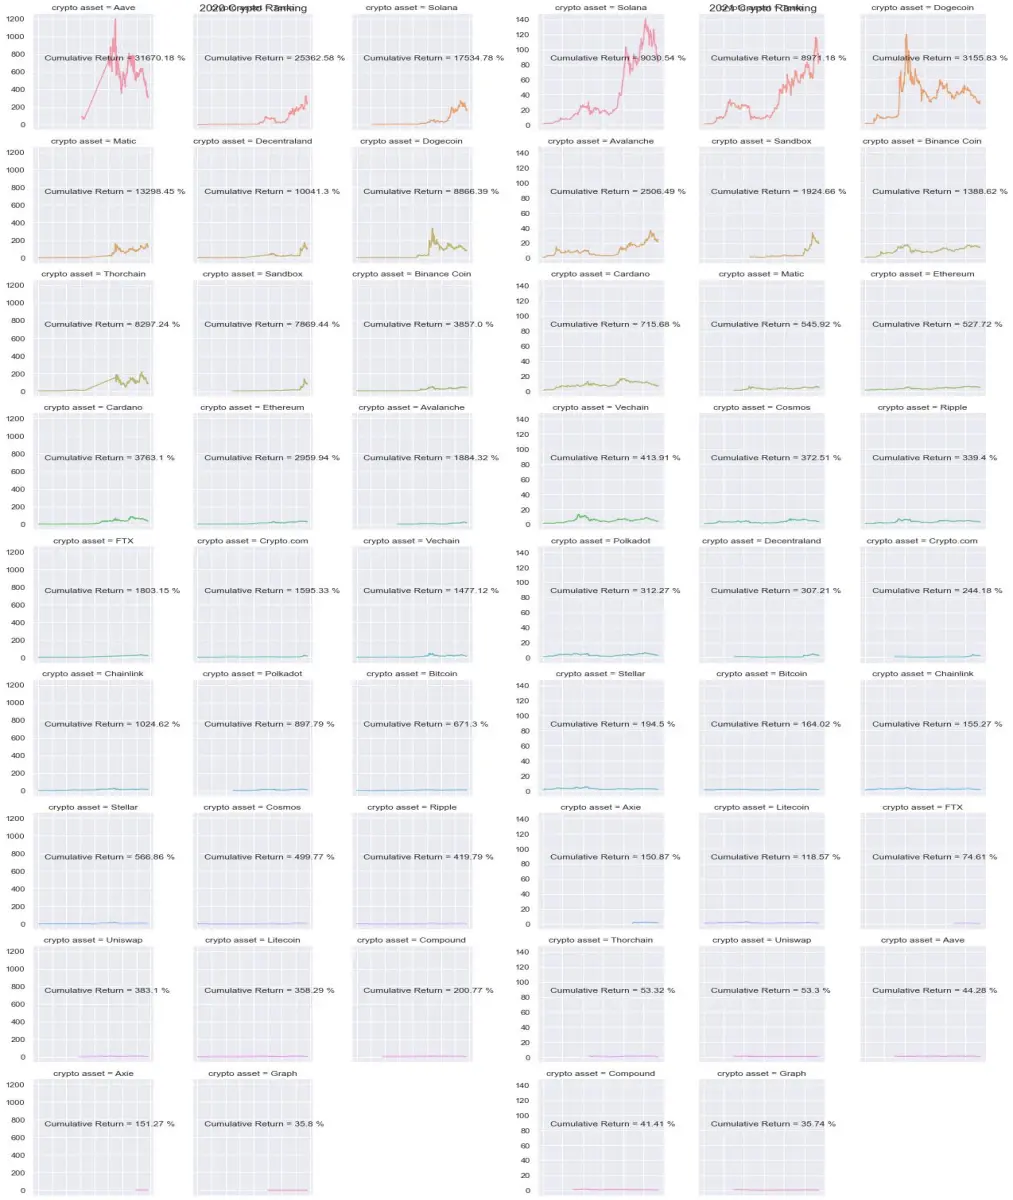
As of 14 Dec 2021, Maker has made a cumulative return of 529.97% since Jan 2020 and 100.69% since Jan 2021. It is currently the 21th greatest performing crypto asset since Jan 2021 as compared to the other cryptocurrencies presented above.
3. Technical Analysis on Maker
3.1. Volume Weighted Average Price (VWAP)
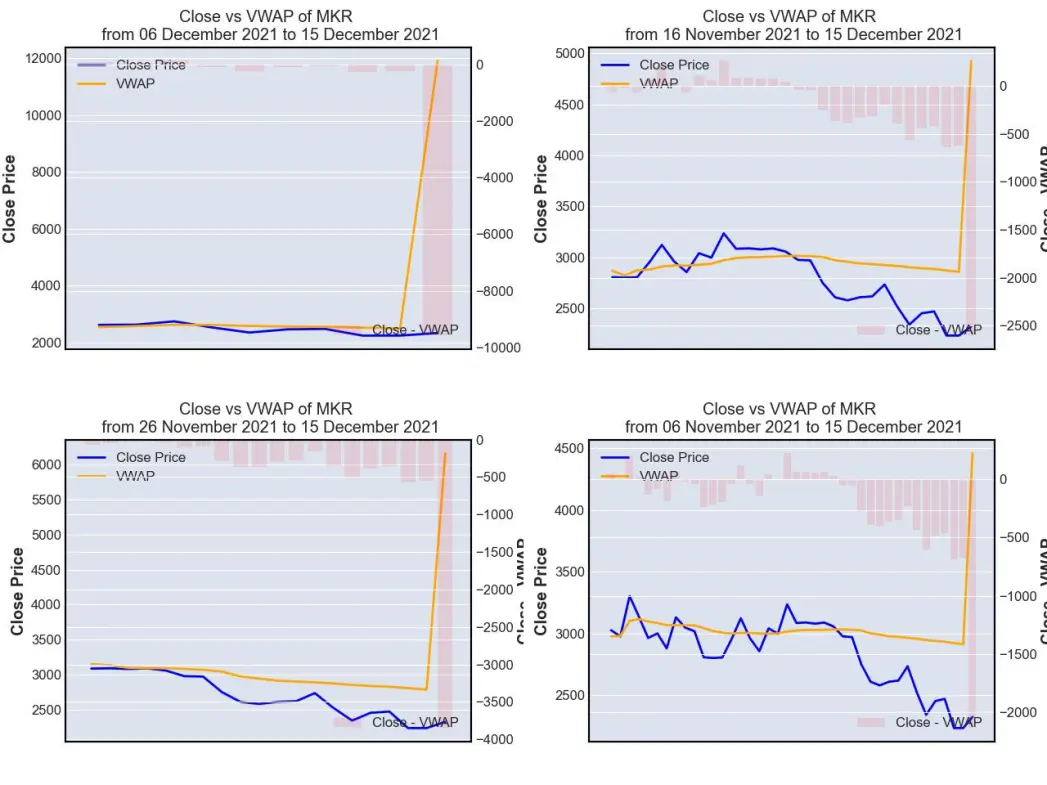
VWAP is a technical indicator used by a trader to gauge the overall trend of an asset price movement. VWAP line (orange line) represents the volume-weighted average price (average price here is defined as the average of high, low and close prices) while close price line (blue line) represents the price when MKR is closed at the end of every single day.
Whenever blue line (close price) is above orange line (VWAP), it indicates that the asset is gaining momentum and being traded higher than its average price level. This would represent a 'buy' opportunity for short-term momentum trader whom task is to trade following the trend while a longer term mean-revision trader might take it as a 'sell' opportunity, anticipating that the price of MKR (blue line) to fall to its average level (orange line).
Whenever blue line (close price) is below orange line (VWAP), it indicates that the asset is losing momentum and being traded lower than its average price level. This would represent a 'sell' opportunity for short-term momentum trader whom task is to trade following the trend while a longer term mean-revision trader might take it as a 'buy' opportunity, anticipating that the price of MKR (blue line) to rise to its average level (orange line).
As of 14 Dec 2021, VWAP is suggesting that MKR is losing significant momentum following a large dump on 14 Dec 2021.
3.2. Moving Average Convergence Divergence (MACD)
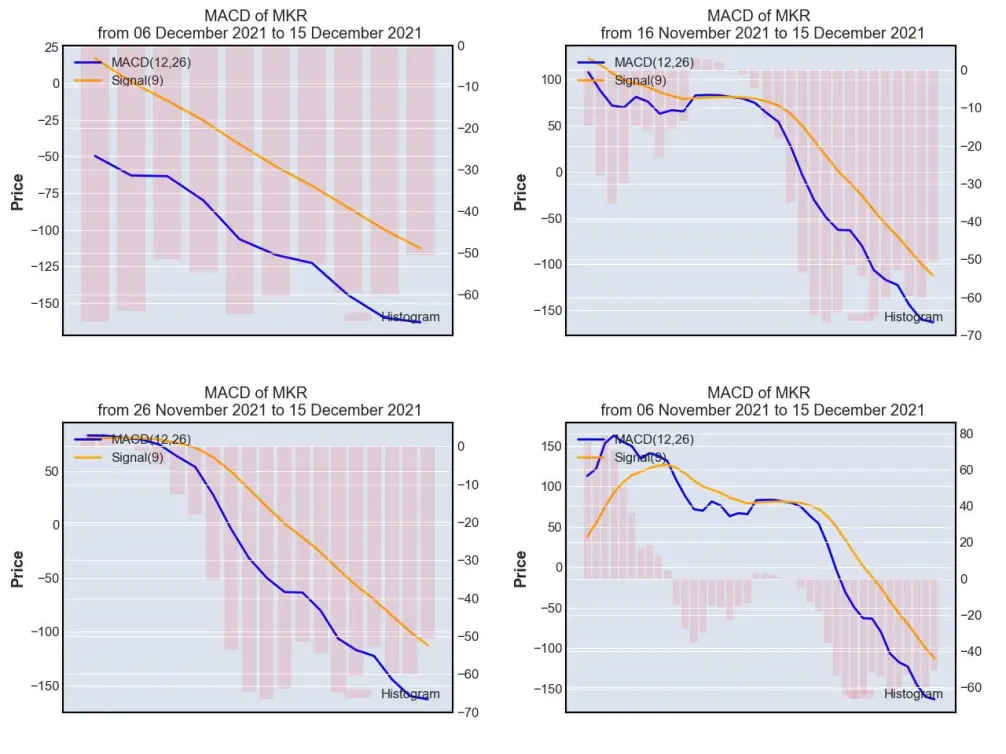
MACD is often used by trader as a momentum indicator. There are 2 lines that form the above charts, namely MACD (12, 26) lines and Signal(9) line, while the histogram is calculated by subtracting Signal (9) from MACD (12,26). Histogram would fall to the negative territory whenever MACD (12, 26) is trending at a lower level than Signal (9) and rise to the positive territory whenever MACD (12,26) is trending at a higher level than Signal (9).
MACD (12, 26) is computed by subtracting the 26-day exponential moving average (EMA) of MKR closing price from its 12-day EMA.
Signal (9) on the other hand is calculated as the 9-day EMA of MACD (12,26).
As MACD (12, 26) goes higher away from Signal (9), it signifies that MKR is gaining momentum and whenever it goes trends at a lower level than Signal (9),it signifies that MKR is losing momentum.
As of 14 Dec 2021, MACD is suggesting that MKR is losing significant momentum following a large dump on 14 Dec 2021.
3.3. Bollinger Band
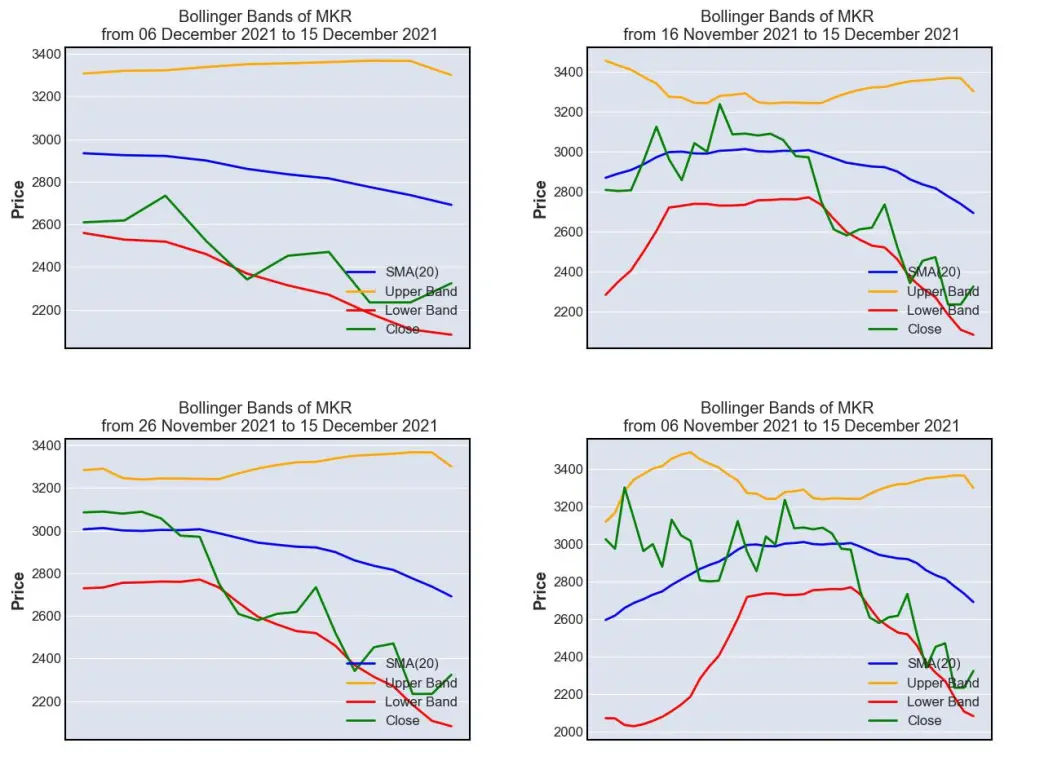
Bollinger band is often being used by mean-reversion trader as a gauge to assess how undervalued or overvalued an asset is. Its chart made up of 4 lines, namely:
- SMA (20) (blue line), which is the 20-day simple moving average price of MKR
- Upper Band (orange line), which is computed by adding 2 standard deviations of MKR on SMA (20)
- Lower Band (red line) , which is computed by subtracting 2 standard deviations of MKR from SMA (20)
- Close (green line), which is the daily closing price of MKR
Whenever close line (green) touches the lower band (red), it indicates that MKR is corrected too much and is being traded at an undervalued level, representing a 'buy' opportunity. On the other hand, whenever close line (green) touches the upper band (orange), it indicates that MKR is gaining too much momentum and is being traded at an overvalued level, thus indicating a 'sell' opportunity.
As of 14 Dec 2021, Bollinger Band is suggesting that MKR has been oversold.
3.4. Relative Strength Index (RSI)
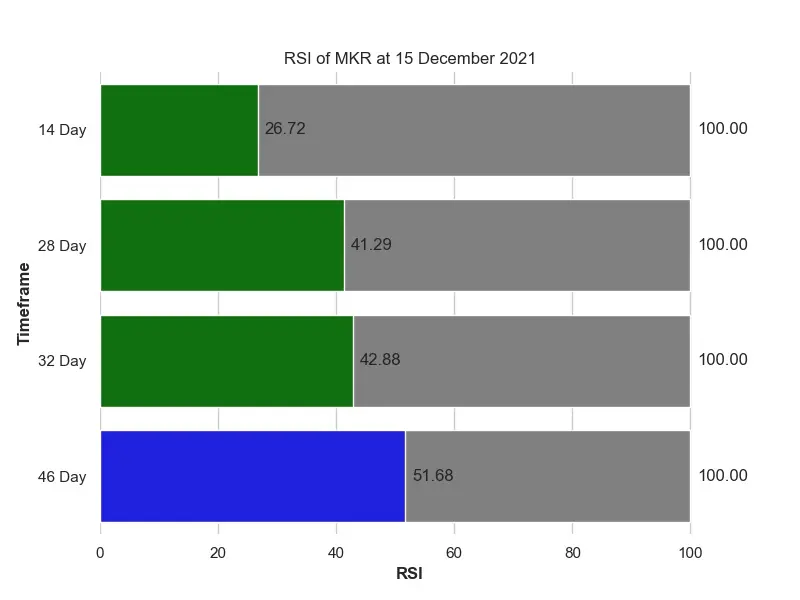
Just like Bollinger Band, Relative Strength Index is often being used by mean-reversion trader as a gauge to assess how undervalued or overvalued an asset is. There are 2 psychological levels, i.e. 30 and 70 in RSI. Whenever the RSI reaches 30, it indicates that MKR is corrected too much and is being traded at an undervalued level, representing a 'buy' opportunity. On the other hand, whenever RSI reaches 70, it indicates that MKR is gaining too much momentum and is being traded at an overvalued level, thus indicating a 'sell' opportunity.
As of 14 Dec 2021, RSI is suggesting that MKR has been massively oversold to an undervalued position.
Based on the technical analysis presented above, quantdoge is bullish on MKR, but I could be wrong, hence please make your careful due diligence before making any financial decision.
4. Maker Risk Profile
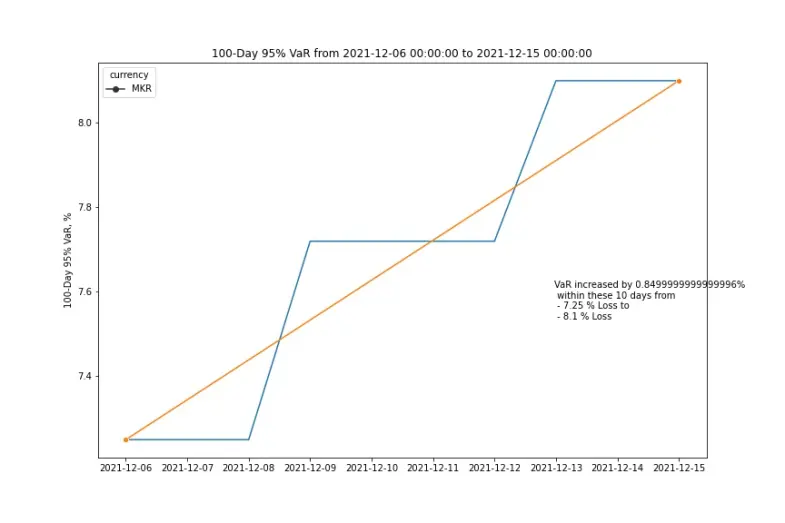
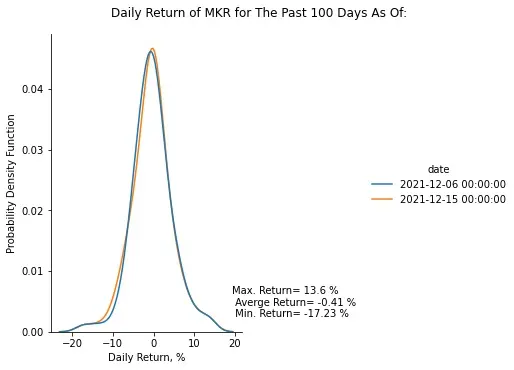
Based on the 100-day 95% historical Value-at-Risk (VaR) profile of Maker defined above, MKR seems to trade at a greater risk level on 14 Dec 2021 as compared to 10 days before on 04 Dec 2021, with its biggest pullback being seen at -17.23% on a single day during the last 100 days. However, I could be wrong, hence please make your careful due diligence before making any financial decision.
5. Monte Carlo Price Simulation for Maker
How did quantdoge simulation perform vs the actual MKR price movement over the last week ?
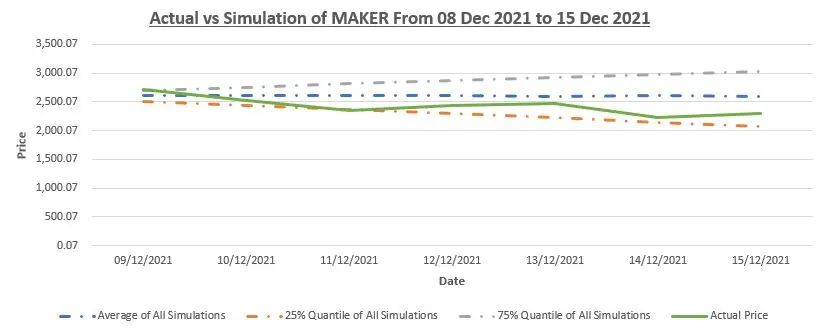
Over the last 7 days, MKR is trading near the lower 25th percentile of all quantdoge simulations, indicating that MKR is being oversold to an undervalued position.
6. MKR Community Analytics
Number of MKR Followers In The Past 24 Months
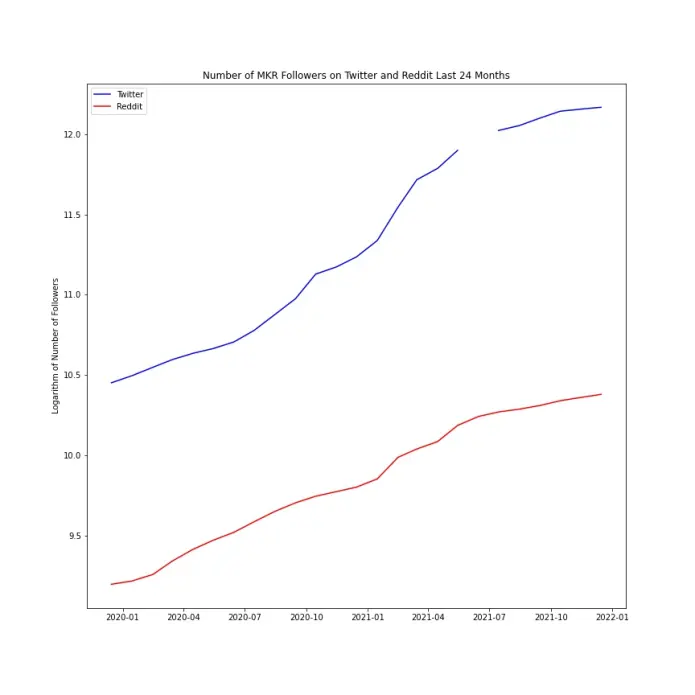
During the past 24 months, Maker followers have grown 455.79 % from 34,616 to 192,392 on Twitter and grown 226.12 % from 9,878 to 32,214 on Reddit.
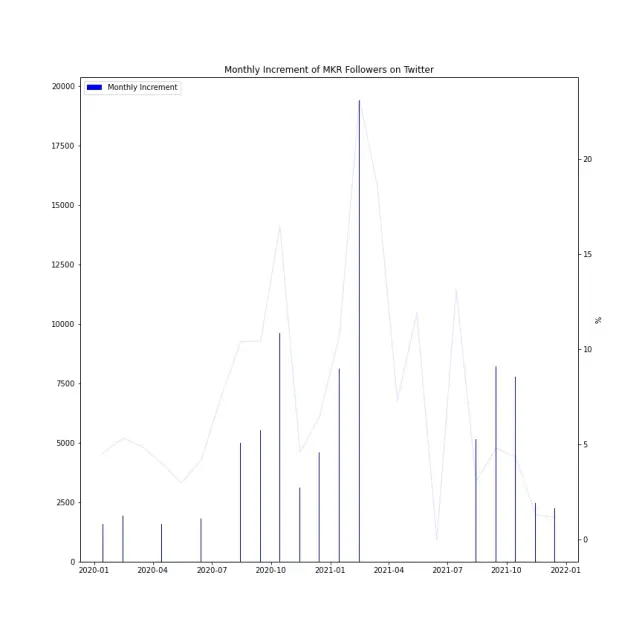
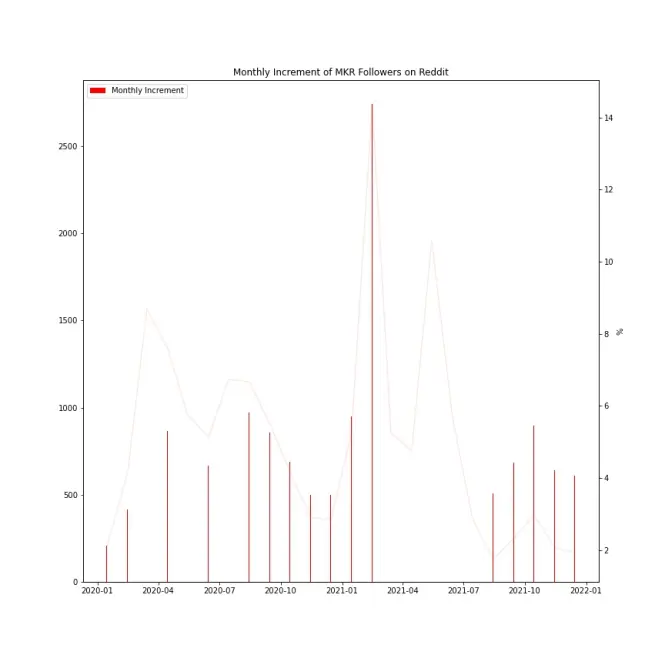
Monthly increment of Maker Twitter followers peaked on Feb 2021 and its monthly increment of Reddit followers peaked on Feb 2021.
Number of MKR Followers In The Last 30 Days
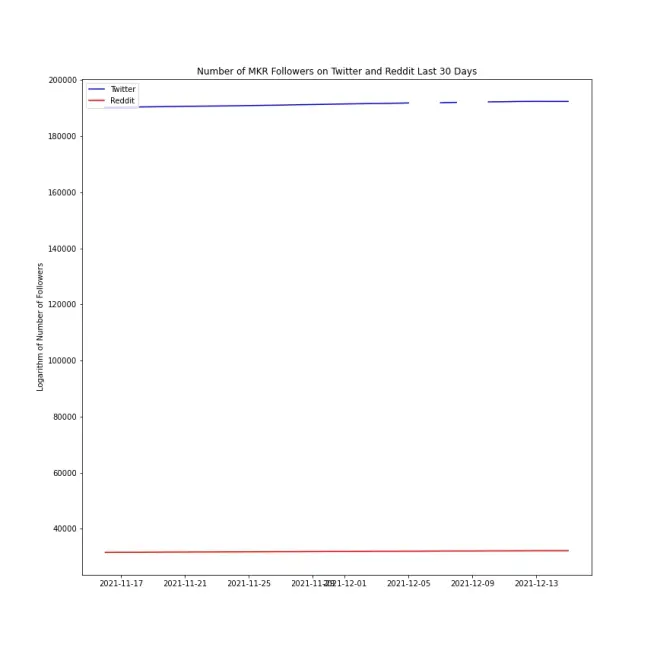
In the last 30 days alone, Maker followers have grown 1.13 % from 190,238 to 192,392 on Twitter and grown 1.86 % from 31,625 to 32,214 on Reddit.
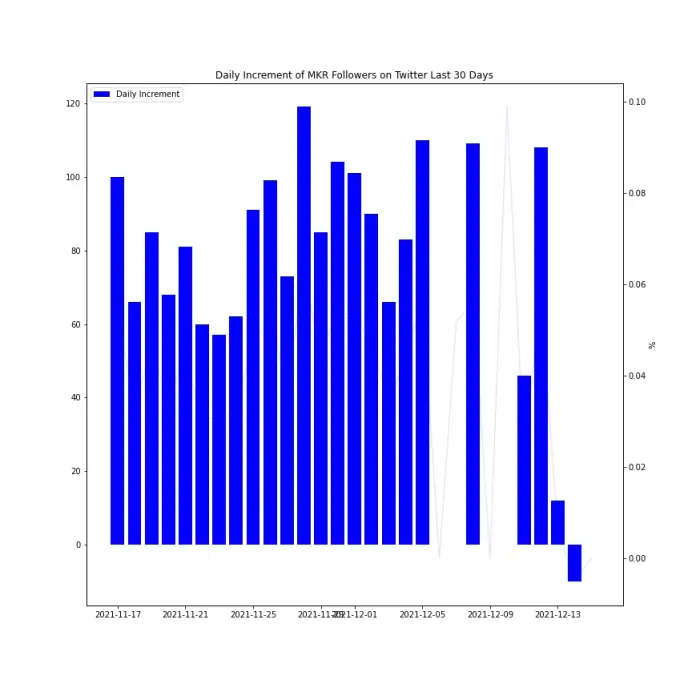
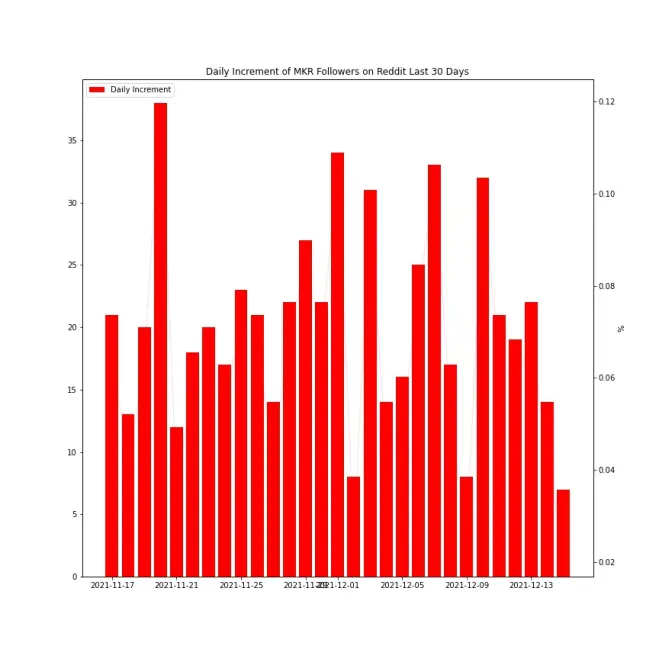
Daily increment of Maker Twitter followers peaked on 28 Nov 2021 and its daily increment of Reddit followers peaked on 20 Nov 2021.
7. Google Trends
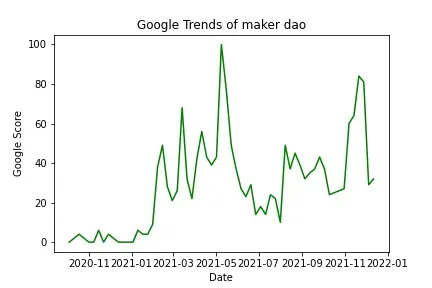
"maker dao" reached its peak in Google Search on 2021-05-09 with a Google Score of 100
Over the last quarter, "maker dao" Google Score has increased 9.71 % from 27.8 to 30.5
Over the last 6 months, "maker dao" Google Score has increased 56.41 % from 19.5 to 30.5
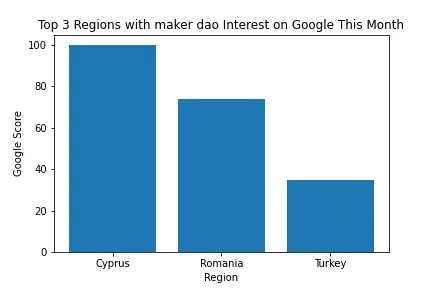
"maker dao" is mainly sought on Google from Cyprus, follow by Romania and Turkey this month.
If you like my analysis and articles, please follow me at @quantdoge for daily updates.
Follow My Twitter for daily updates: https://twitter.com/quantdoge