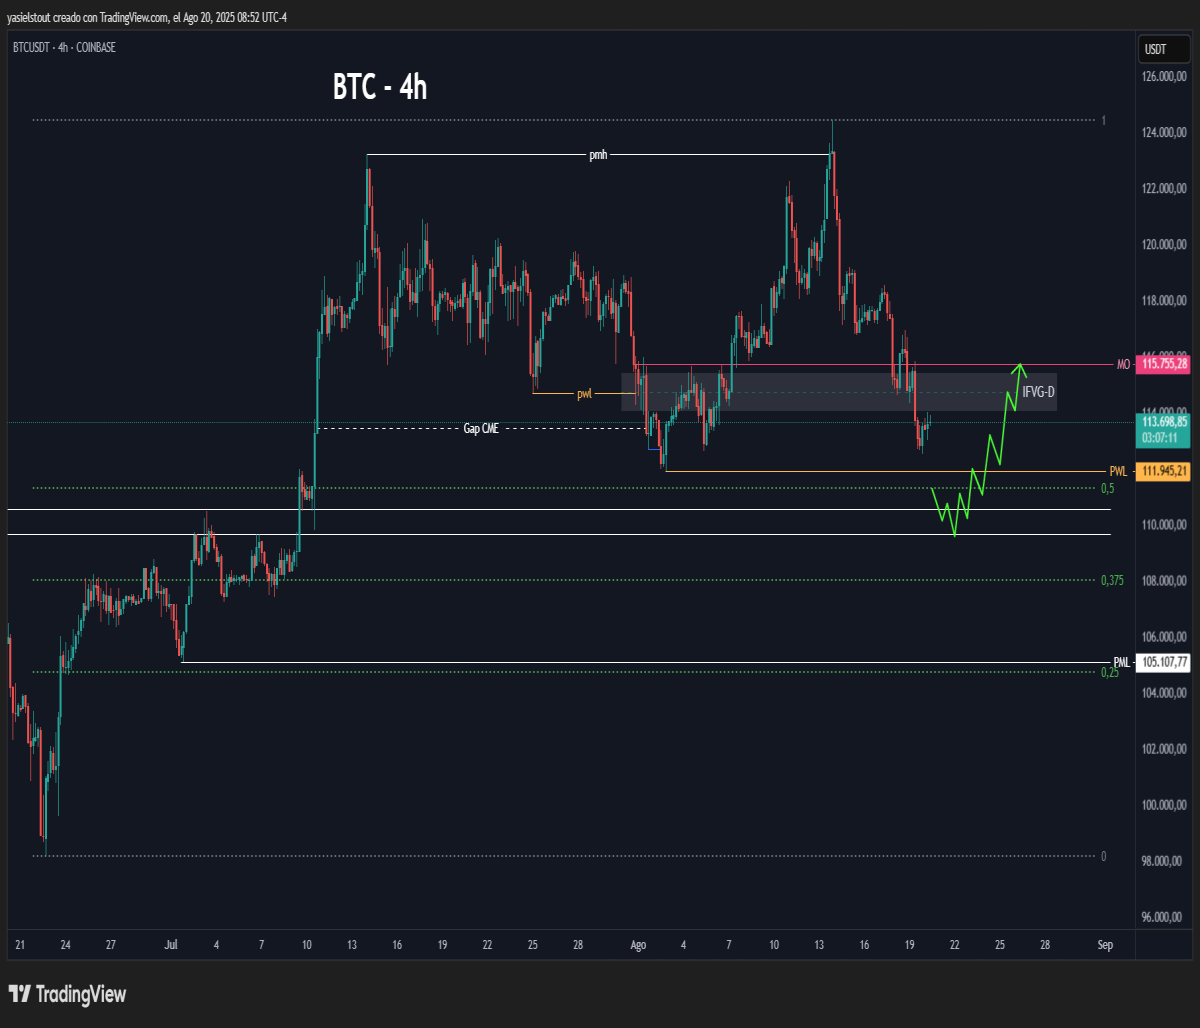
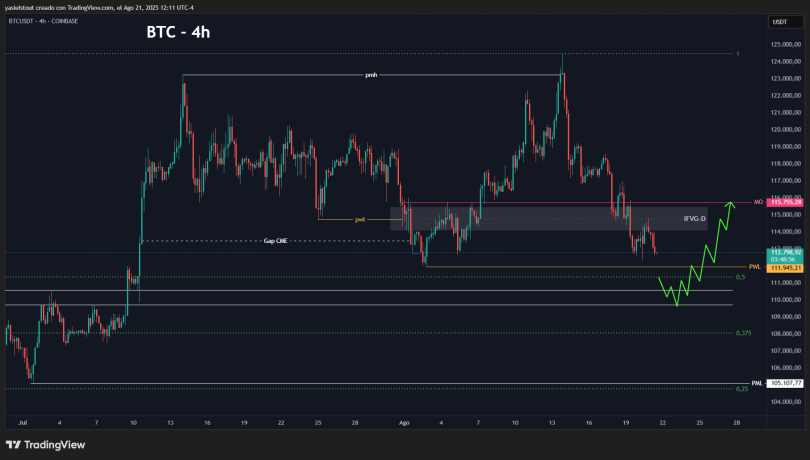
Yesterday, the daily candle closed below the IFVG-D. I'll be monitoring these possible scenarios today.
Above, the IFVG-D is an area that, along with the monthly open, will exert downward pressure.
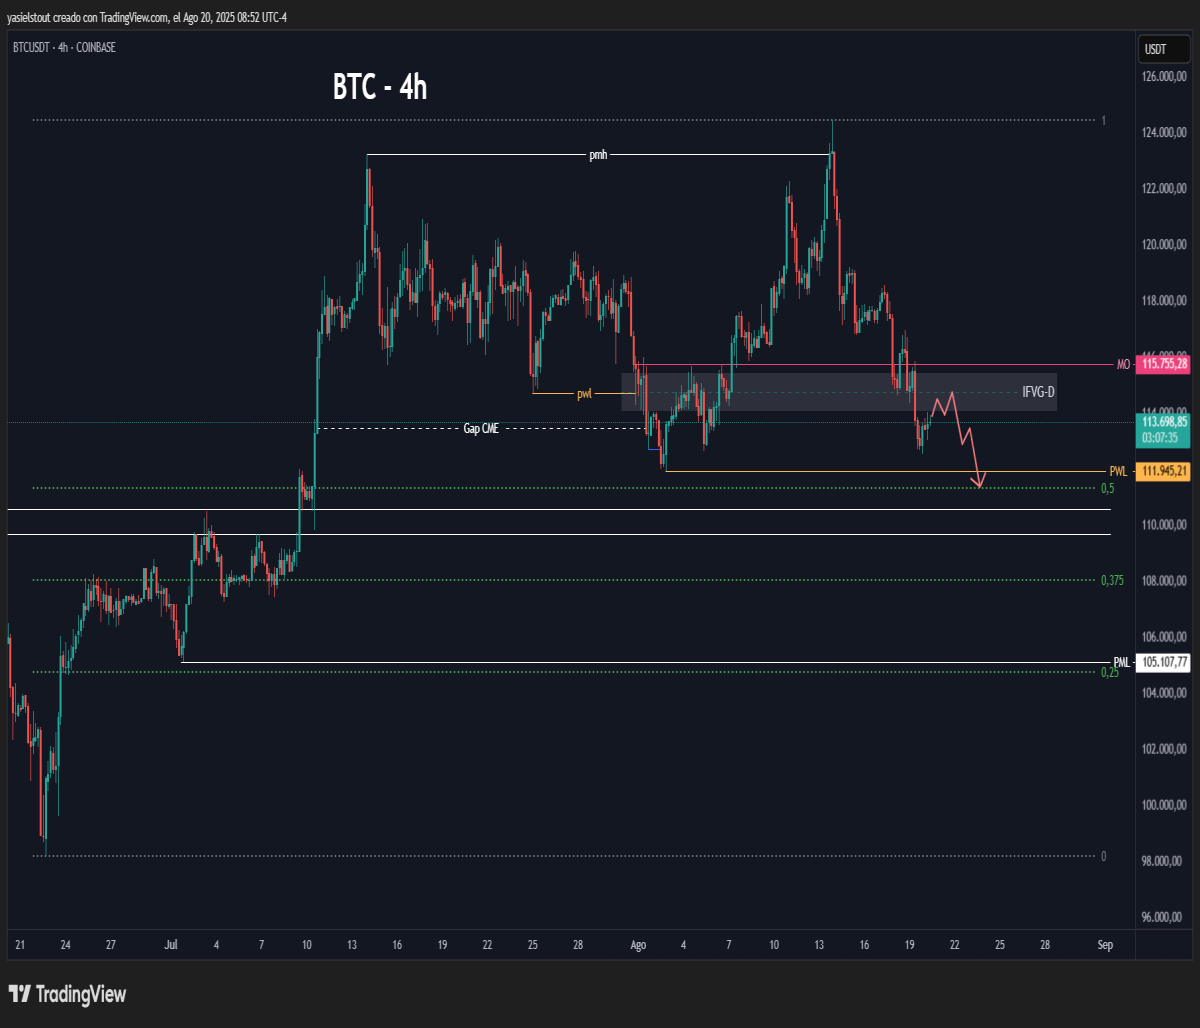
Below, the 50% zone and the monthly highs (white lines) will be the liquidity zone that could drive the price higher in the short term.
.
.
.
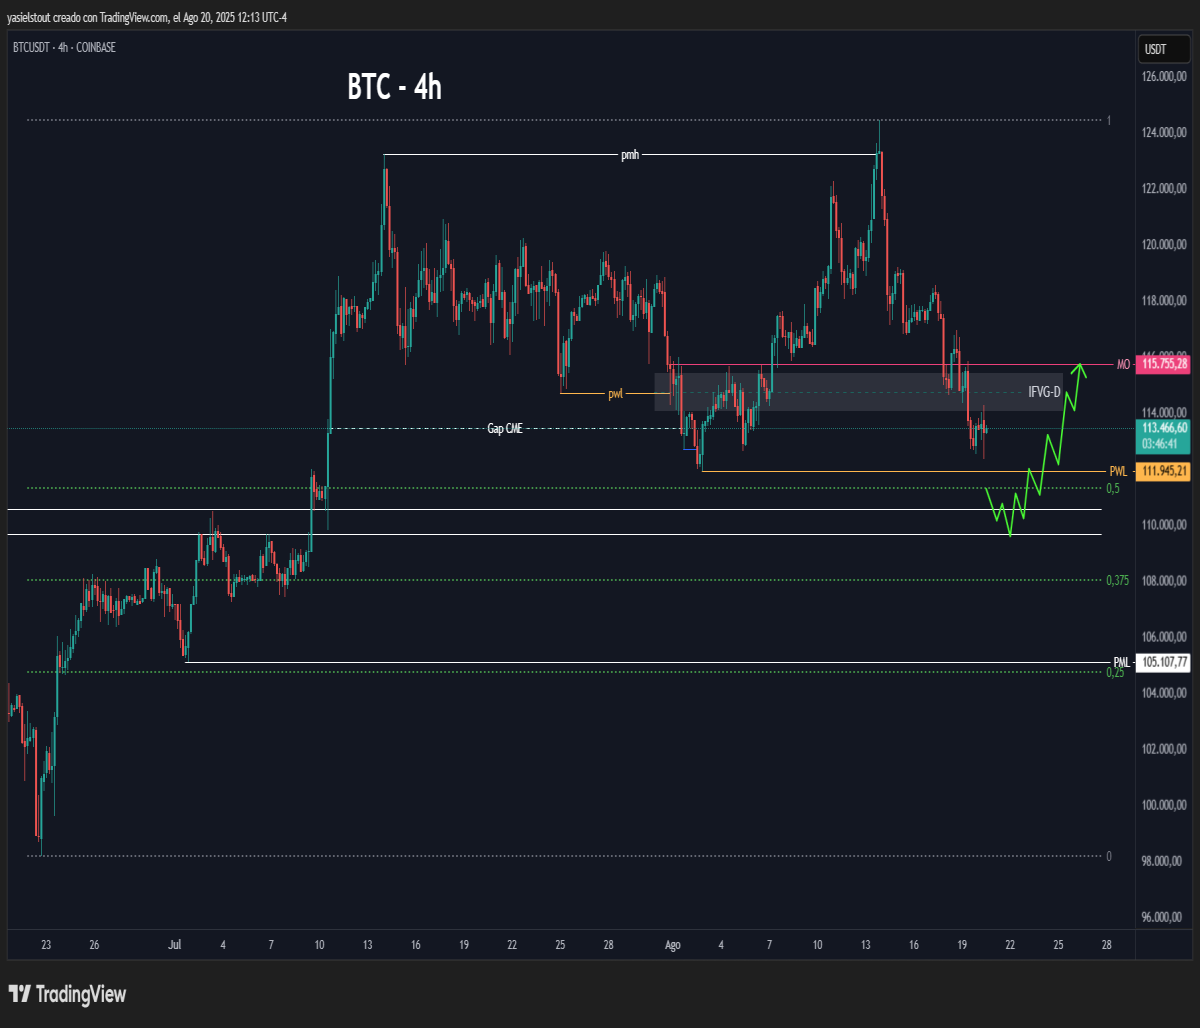
UPDATE: 8/20/2025 (12:15h NY)
Wait for key levels before making a decision. Buys are managed below the 50% level because that's where you have a probabilistic advantage.
.
.
.
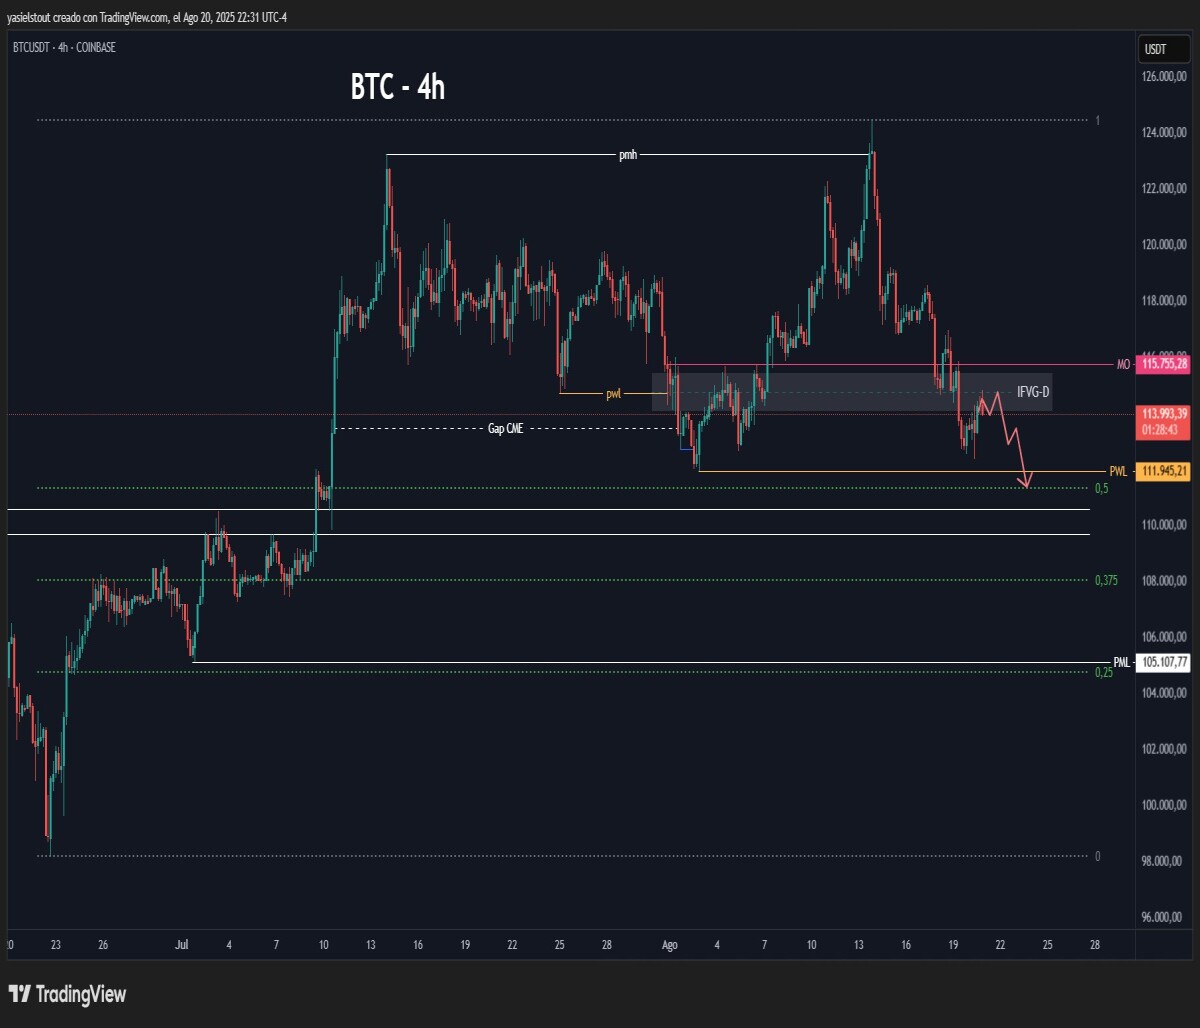
UPDATE: 8/20/2025 (22:50h NY)
If you're shorting this trade... protect the trade with a SL above the IFVG-D
...and at the first opportunity, take partial profits and activate BE.
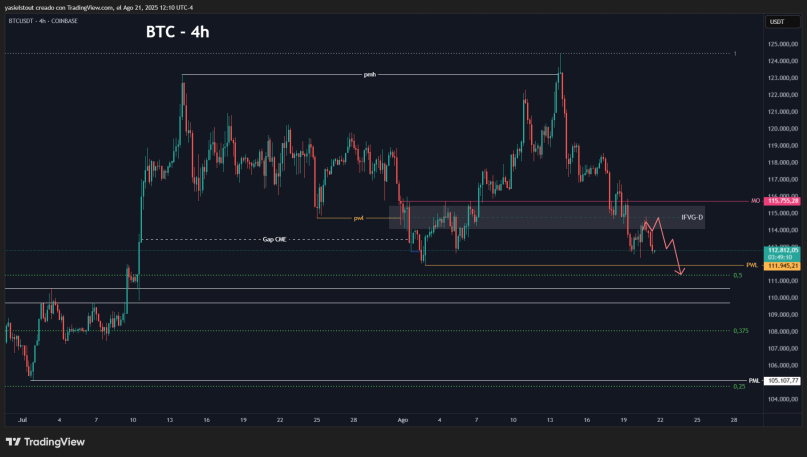
UPDATE: 8/21/2025 (12:15h NY)
This is where you start closing the short and prepare to look for confirmations to buy.
...