
Have you ever wondered the percentage movement of BTC price between the Bear/Bull cycles. In this blog I looked at the percentage of BTC price correction from the top of the bull market to the bottom of the bear market and appreciation from the bottom of the bear market and the top of the next bull market. I have also looked at the percentage movement between the top of the previous bull market top and the top of the next bull market together with the bottoms of the consecutive bear markets.
Bear market August 2011 to October 2011
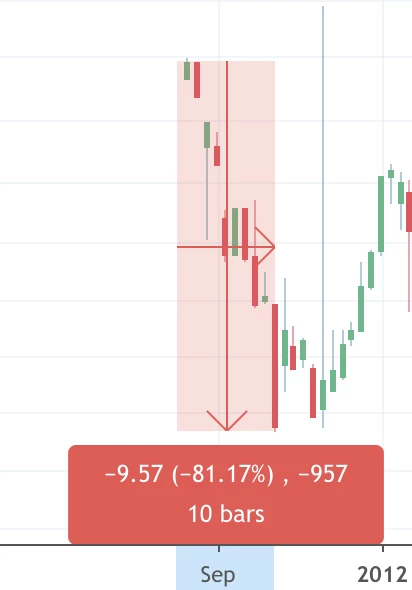
The correction was about 81% and it took 10 weeks.
Bull Market August 2011 to April 13
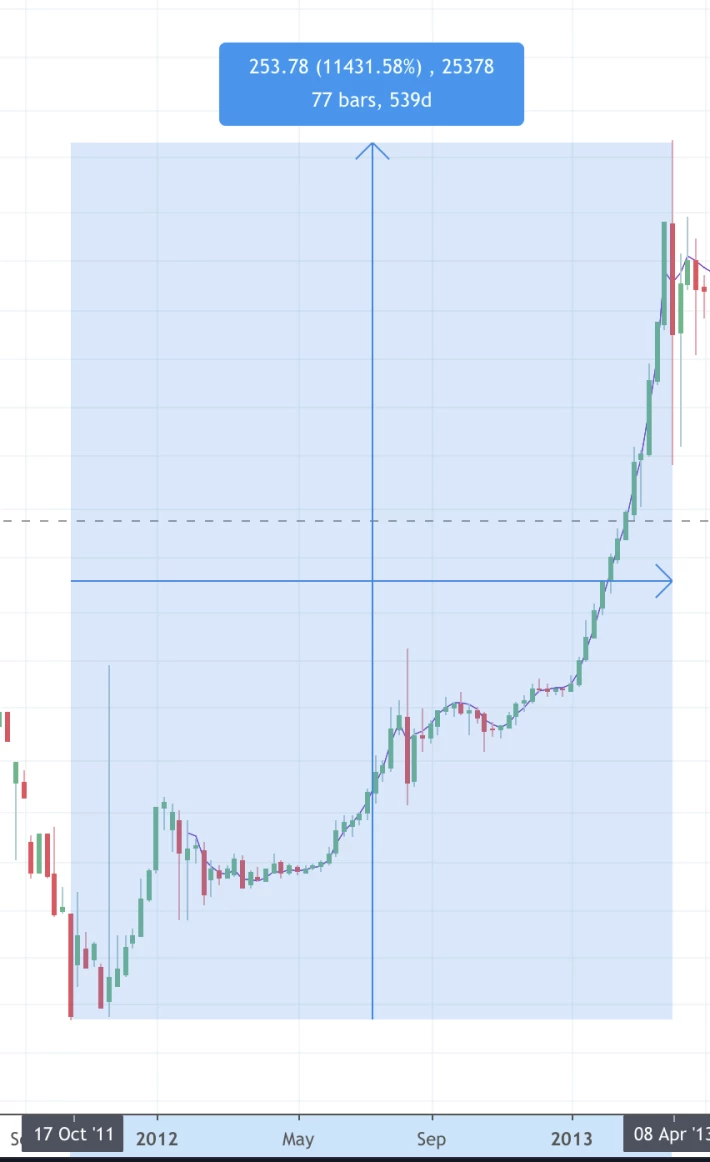
Bull market took 539 days with 11 431% appreciation.
Bull top Aug 2011 to Bull top Apr 13
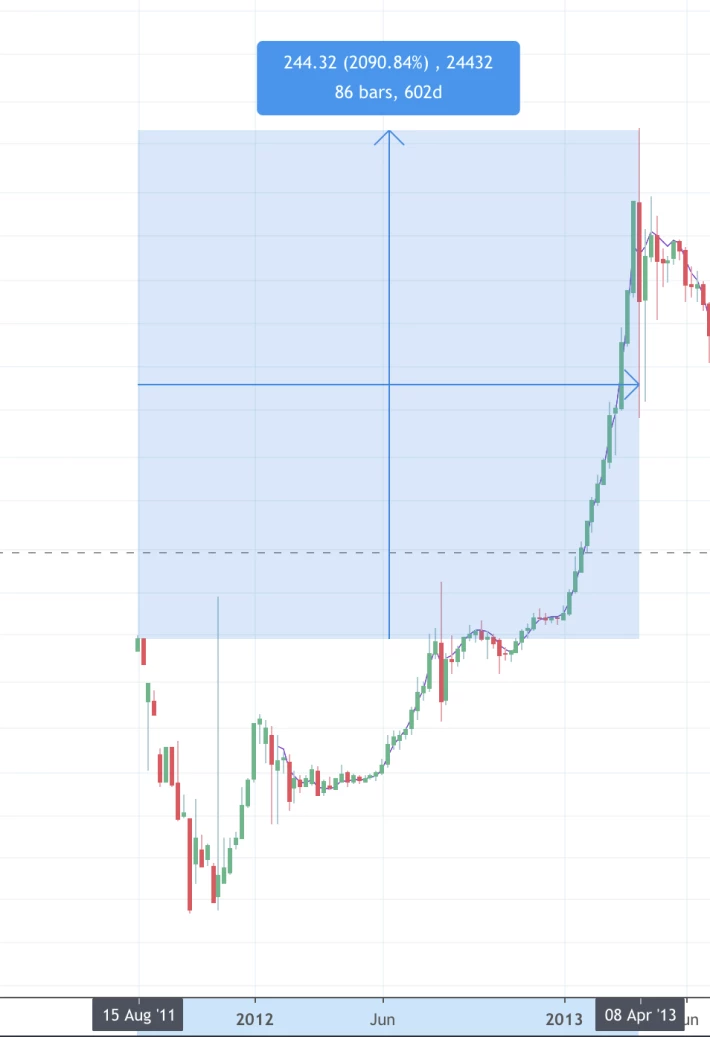
From the top of the previous bull market to the top of the next bull it took 602 days and the overall increase was about 2 090%
Bear bottom Oct 11 to Bear Bottom July 13
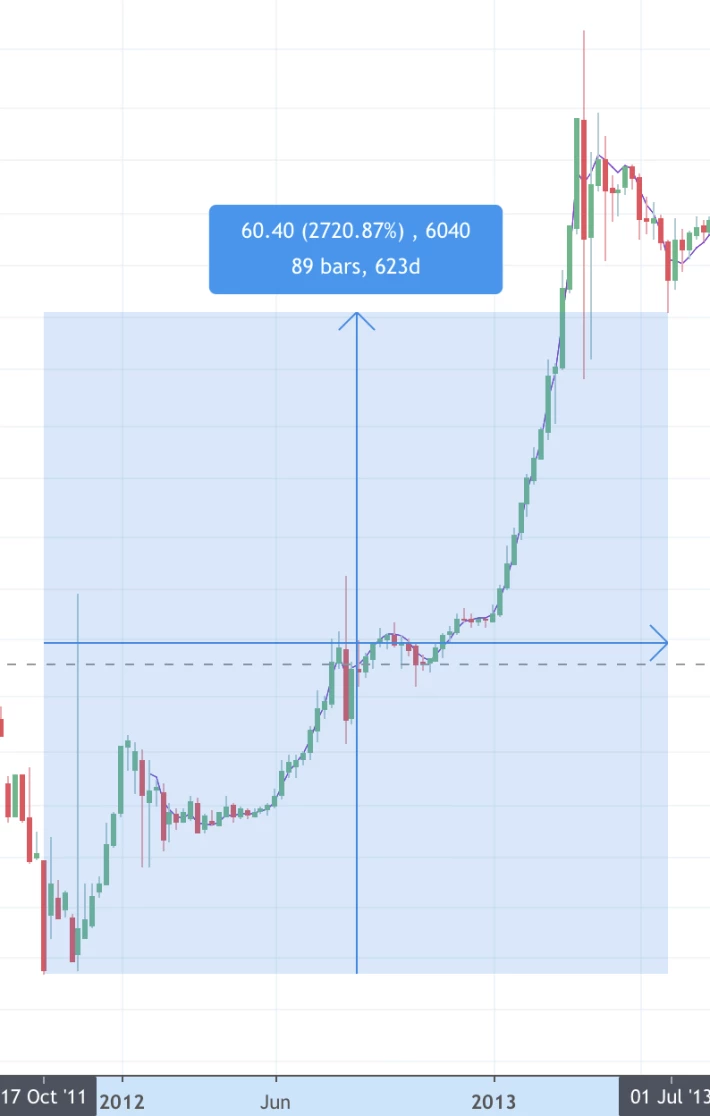
It took 623 days to move from one bear bottom to the next bear bottom. The price went up by 2 720%
Bear market April 13 to July 13
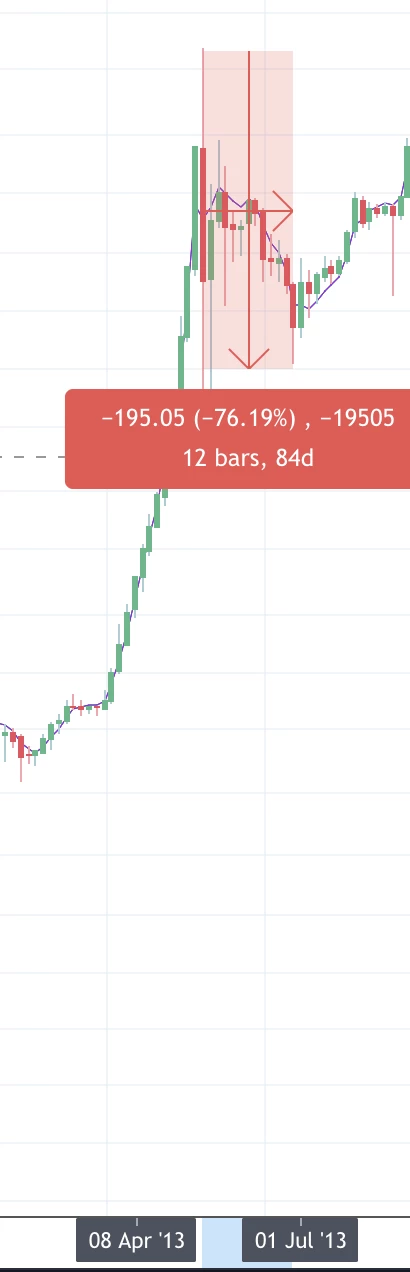
This was the shortest bear market that took 84 days with price decrease of 76%
Bull market July 2013 to November 2013
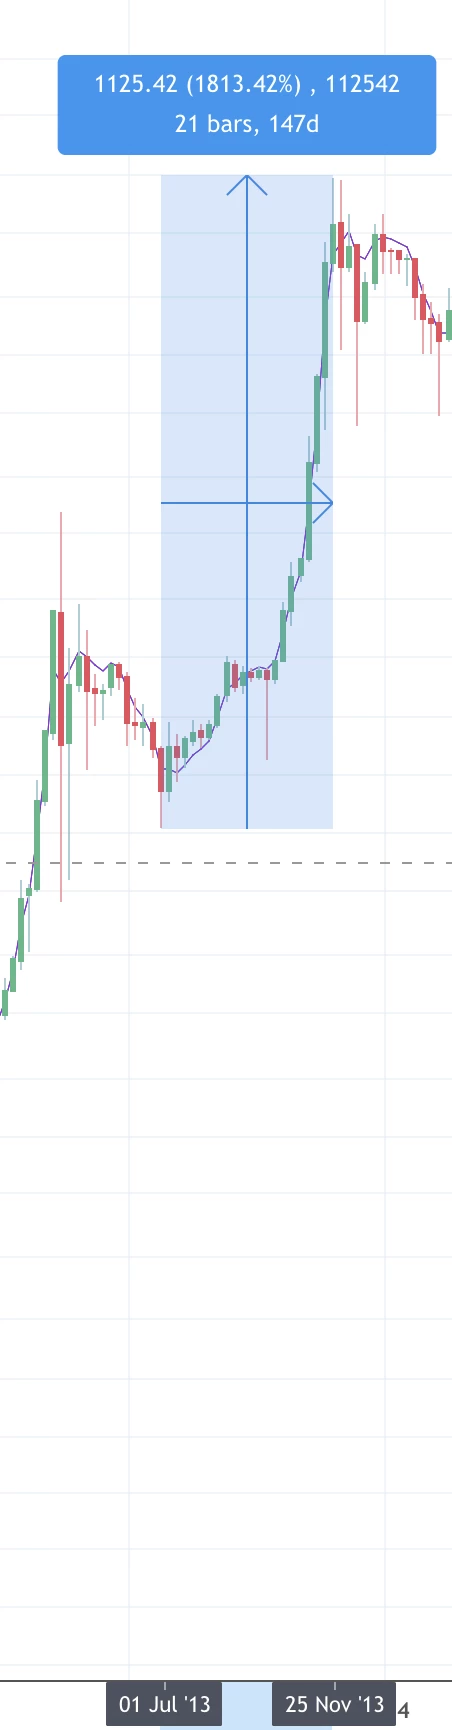
Another short bull market, 147 days and 1 813% increase in price
Bull market top April 2013 to Bull market top November 2013
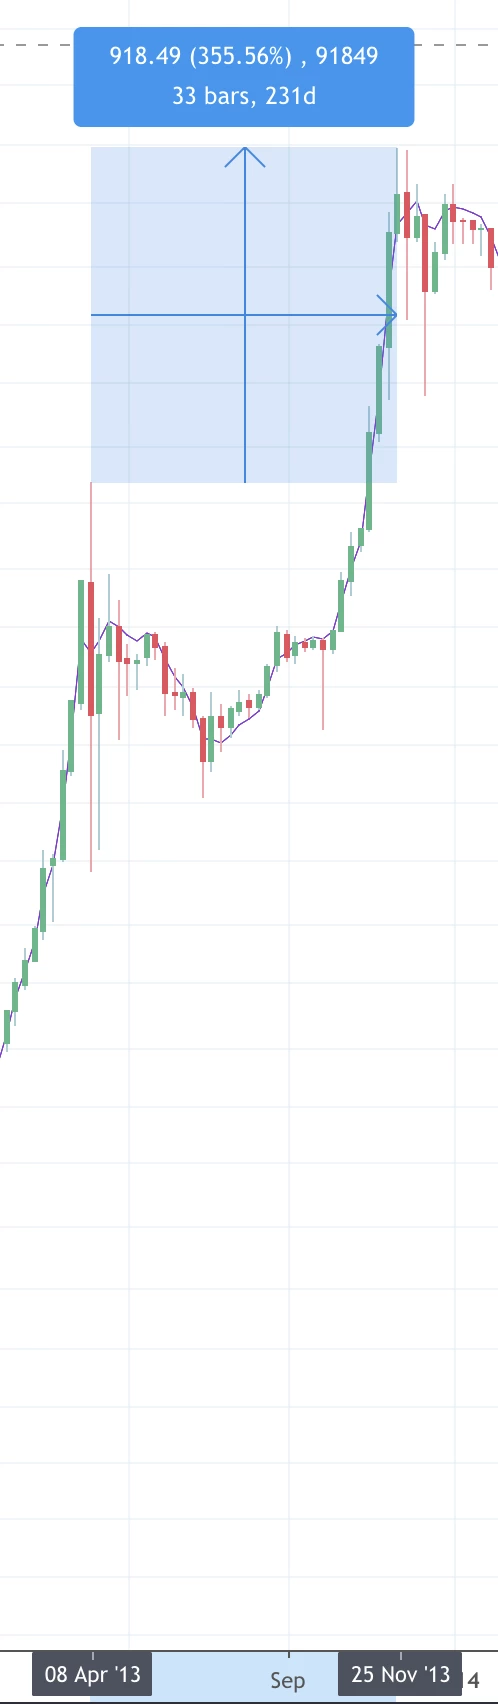
One bull top to another was 355% increase that took 231 days.
Bear Bottom July 2013 to Bear Bottom January 2015
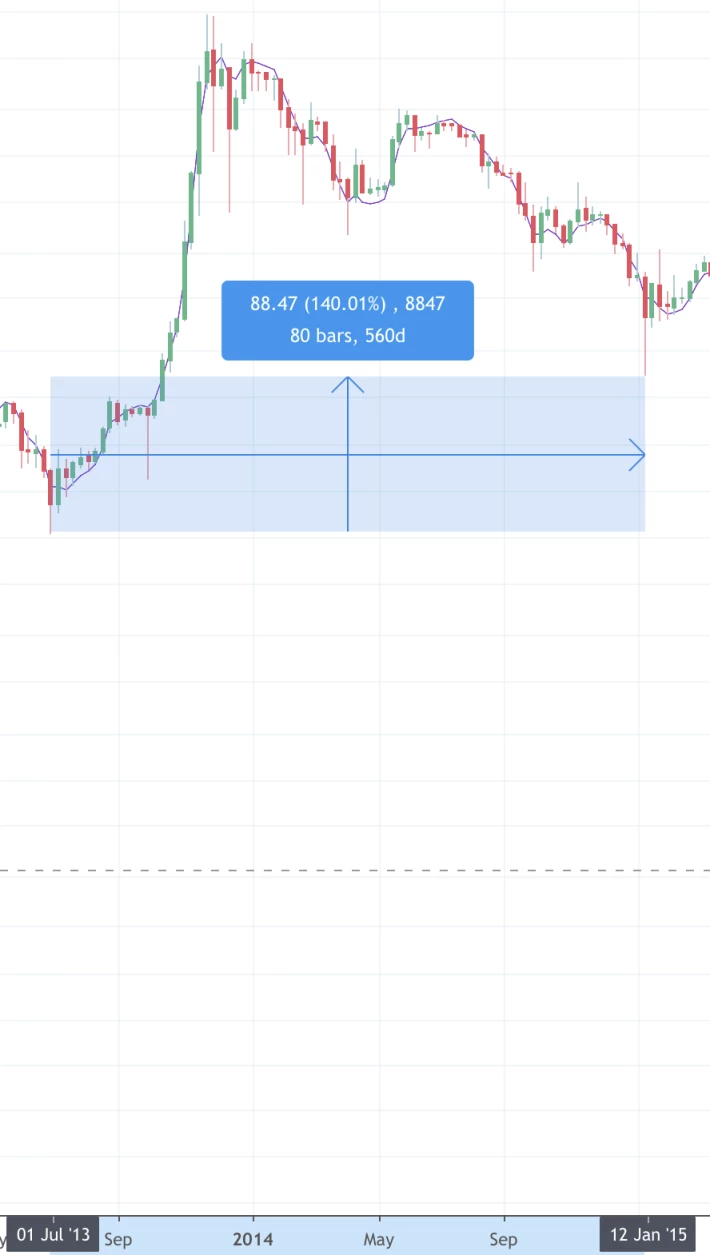
This bear bottom to another bottom took 560 days for 140% overall increase.
Bear market November 13 to January 15
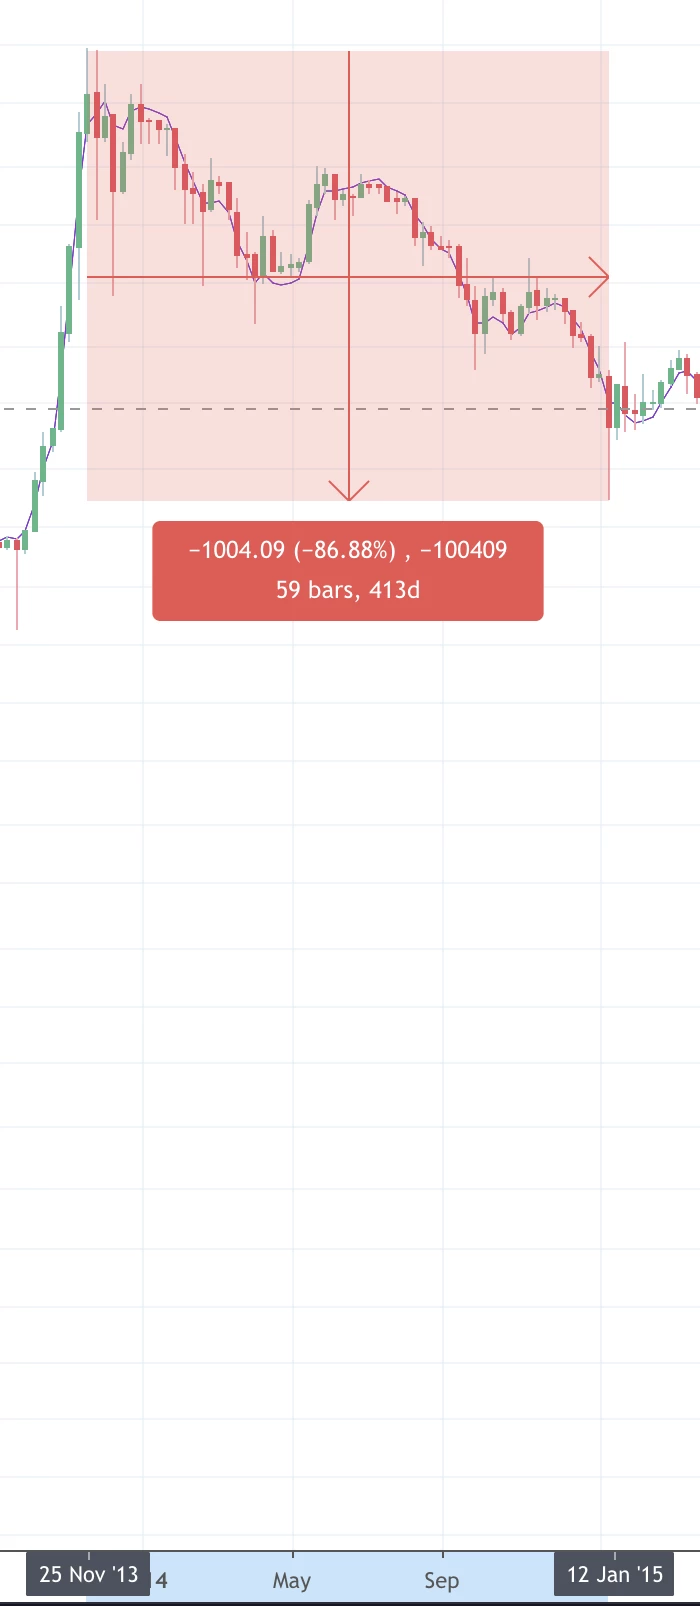
About 87% bear market that took 413 days.
Bull market January 2015 to December 2017
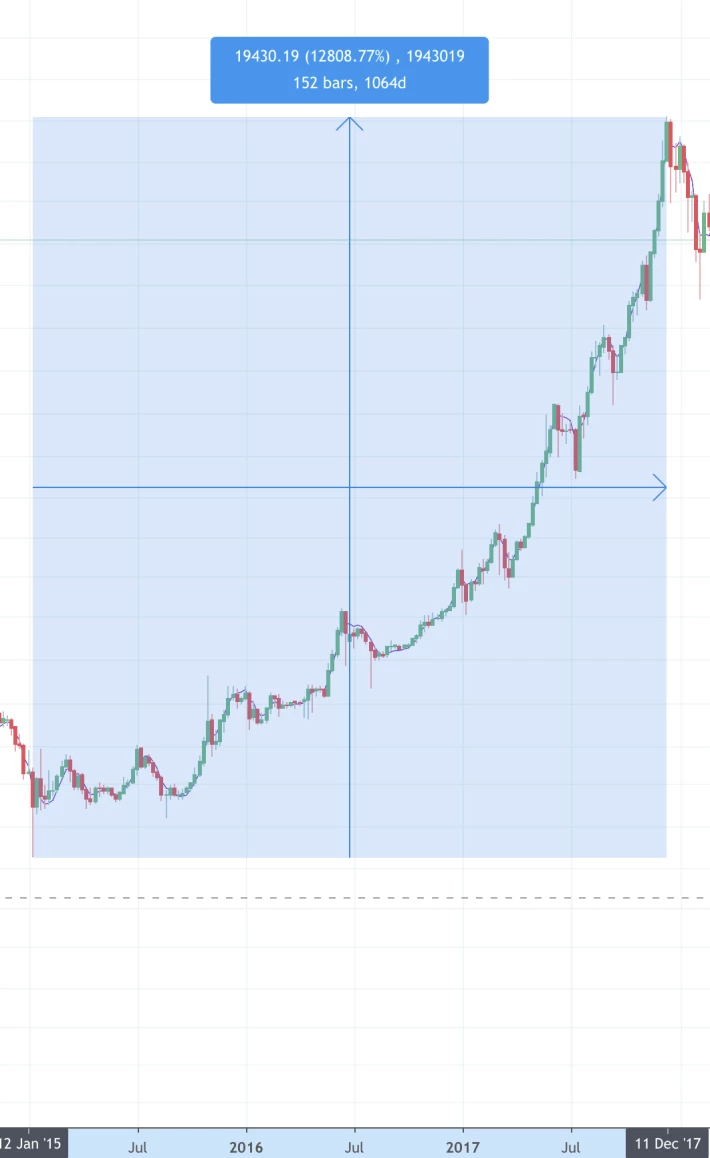
This was a monster bull market that took 1064 days, it resulted in 12 808% increase.
Bull market top November 2013 to Bull market top December 2017
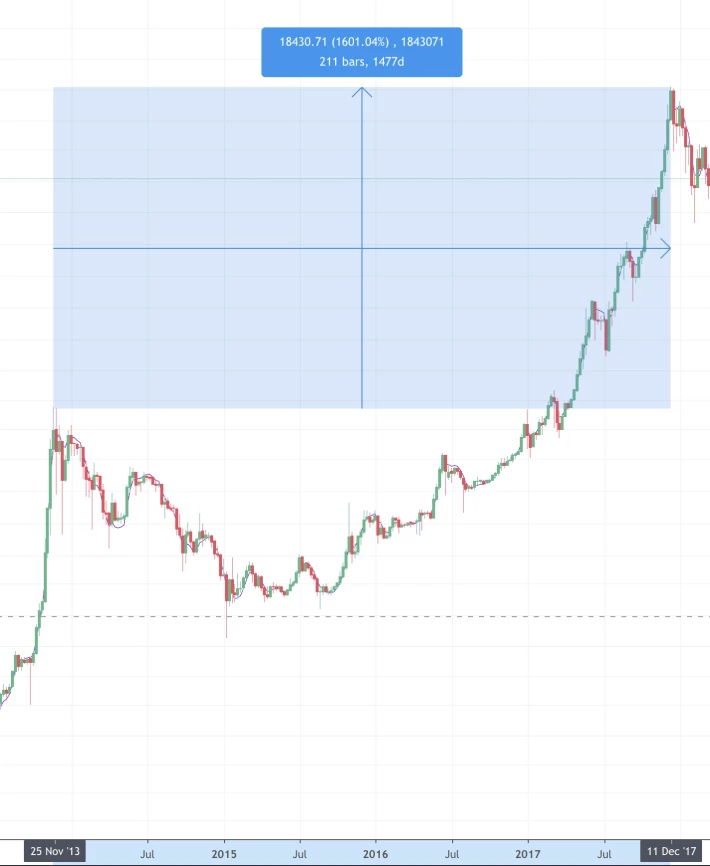
Bull top to another top that took 1 477 days and 1601% in price appreciation.
Bear market bottom November 2013 to Bear market bottom December 2018
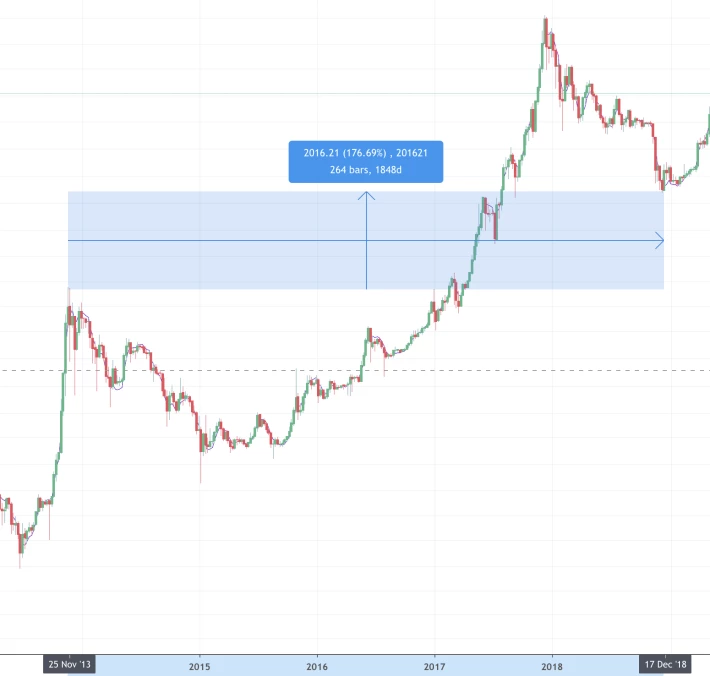
Bull top to the bottom of the next bear market took 1 848 days and the overall increase was 177%.
Bear market December 2017 to January 2019
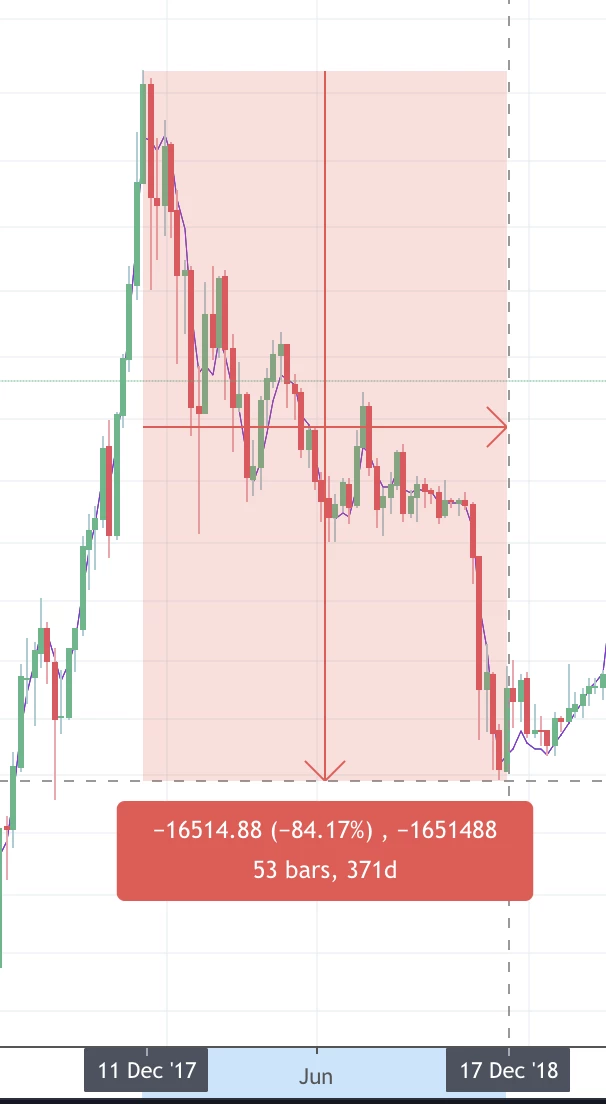
The last bull correction resulted in 84% decrease in price that took 371 days.
Conclusion
In conclusion the next bear bottom is always higher than the previous bull top.
The smallest increase ever from the top of one bull market to the other was about 355%.
If we use this as a bench mark then we can expect the next top to be at least $70 500






