
Just when everyone was expecting a green candlestick that was supposed to take Bitcoin to the moon, a red one appears that brings us all back down to earth.
What happen? Is there still hope for 2024? This and much more is echoing in the minds of late-breaking traders and investors. Here, however, it is a must to remain calm and analyze market movements with a cool head. For this reason, therefore, we collect all the data and see which scenario best describes the upcoming events.
With Bitcoin you go up the stairs and down the elevator.
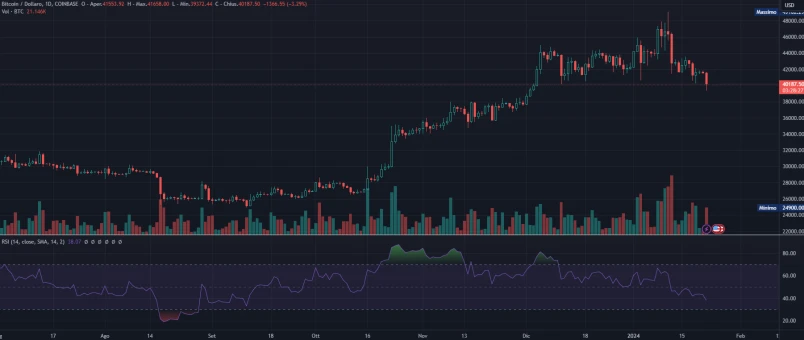
Bitcoin has gotten us used to sudden movements, especially downwards. However, those who have been in the sector for a short time do not know these "sudden earthquakes" that affect the price and often remain lost, without references. The natural consequence of volatility, then, is the arrival of fear, uncertainty and doubt. Market sentiment, therefore, is the exact opposite of when the price rises and FOMO arrives and this can also be seen from more concrete and objective indicators such as the RSI. The RSI describes the strength with which investors buy (or sell) an asset and in the BTC/USD chart it is moving towards the "oversold" zone, in contrast for example with the period of mid-October 2023 when it was above the overbought threshold. In short, therefore, those who had previously purchased Bitcoin are now selling it.
But why now? And who are the entities that are pouring so many BTC onto the market that they are impacting the price in this way?
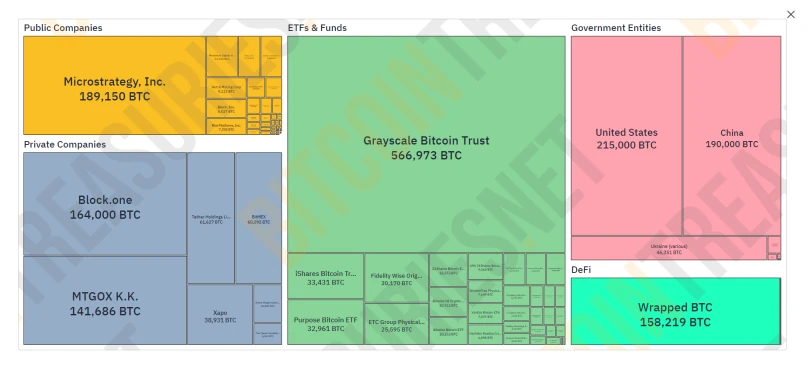
As we well know, about ten requests for spot ETFs on Bitcoin have recently been approved. Among these there was also the conversion of a Trust by Grayscale which, as we know, is a large holder of Bitcoin. Those who purchased BTC from the Grayscale Trust a year ago were able to enjoy a strong discount as it was not known whether it would then be converted into ETFs. Now, following the conversion, what is happening is a simple take-profit by those entities that want to make a profit from their investment.
So are these just market sales of the financial product offered by Grayscale? I would say no. It must be considered that in just a few months Bitcoin has gone from $25,000 to almost 50 thousand, which means multiplying by two the profit of anyone who purchased between August 2023 and October. Therefore, the audience of those who are selling now must expand to all short-term investors and not just institutional ones. Furthermore, usually below an important support such as that at $40,000 there are many stop-losses hidden by traders which, if triggered, lead to the liquidation of open positions. In the case of Bitcoin, in fact, the $40k represents both a psychological support, being a round figure, and an area where multiple trades have occurred in the past. With the latest downward movement, therefore, Bitcoin blew up all the positions with the stop-loss placed in the support area and tested it forcefully. From here two scenarios open up: the first sees a retest and a subsequent rise towards $45,000 while in the second case BTC could break the support and then hypothetically drop to $35k. The lower support area, in fact, is located precisely at $35,000 and originates from a liquidity zone formed at the beginning of 2022. The quantity of positions liquidated with the ongoing movement will decide whether and how much the price will fall. Likewise, the quantity of investors and traders ready to buy (or open long positions) below $40,000 will decide how much and how quickly the price will return towards the starting value.
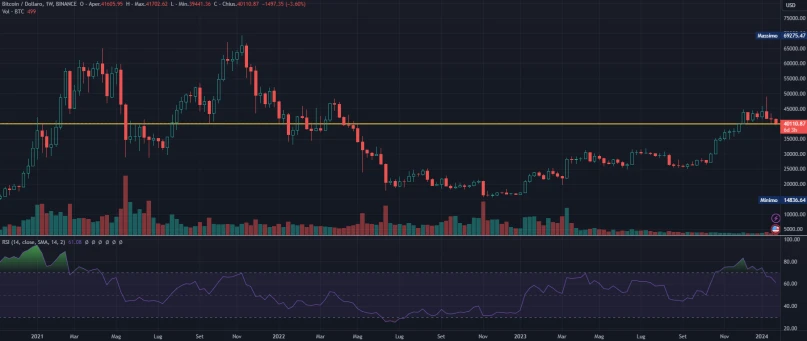
The latest weekly timeframe candlesticks are not entirely bullish for Bitcoin. The one that gave rise to the bearish movement, then, presents a strong upper shadow which is a sales index. Considering then that the RSI value is below 40, i.e. in a neutral/bearish trend, there is no doubt that a period of price decline is looming. Furthermore, in the last week there has been a significant decrease in trading volume and by taking a quick look at the Bollinger Bands you can see how they are expanding. This is a signal that indicates increased volatility and potentially the entry into a bearish trend, as the price has touched the lower band twice. All signs therefore lead to the conclusion that in the coming weeks we could see Bitcoin drop a few steps in the price ladder, giving the perfect opportunity to enter for those who want to accumulate some more before the halving.
Read Also:
Interested in buying a TESLA? Here is the link from which to start to get numerous prizes.
If you liked this article, please support me by following me here and on X or DeBank, leave me a like or use one of my referral links below. 👇
➡️ Join Binance, trade and earn passively.
➡️ Buy a Tesla from the official website.
➡️ Use Nexo to make your cryptocurrencies profitable ($35 free)
➡️ Buy an Unstoppable Domain ang get 10$ free
-Thank you-
⚕️Luca


