
The month of April opened with a weak optimism on Bitcoin, which was immediately crushed after only about ten days. So let's shed some light on the most recent movements, with a quick look but also attentive to the general trend.
Technical Analysis
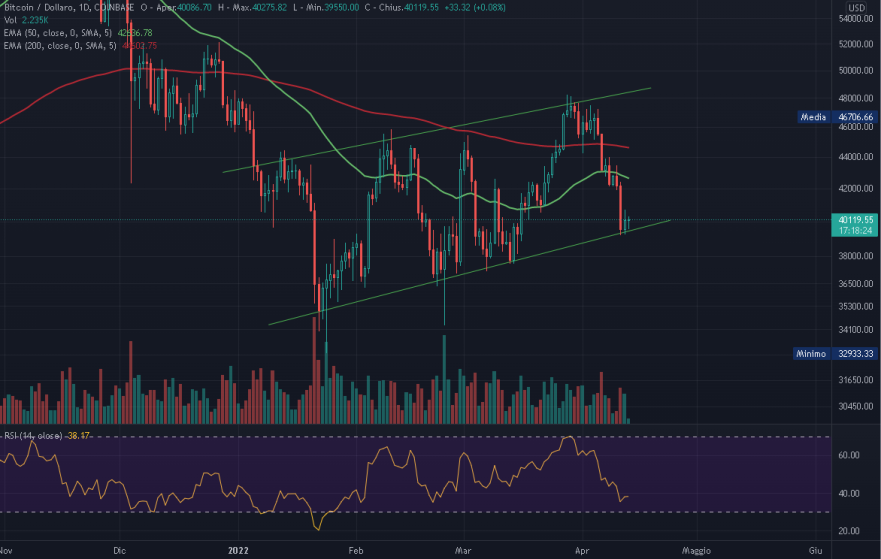
In the short term, after bouncing off the MA200, the BTC/USD (Tradingview) chart has built what many refer to as the Bear-Flag. It is a graphic construct characterized by the fact that the price often breaks this structure down. It is certainly not even very evident, but if the 48k level is not recovered in the next few days, this structure could be confirmed. Furthermore, at the moment Bitcoin is on the last useful support that separates us from the lower price area and it seems that this has no intention of holding up. The 50-period moving average has returned to be a resistance, while a few days ago it was a support. The RSI indicator is heading towards the over-sold zone and, although it is not very close at the moment (38), this indicates a majority of sales over purchases. If we consider the purchases made by Terra last week, the one relating to the RSI is a fact that speaks volumes. Finally, the volumes do not seem to have diverged from those of last week, thus remaining at fairly low levels. The overall picture, therefore, remains bearish in the short term and would only change upon recapturing levels above $48,000. Despite this analysis, expanding the graph to the previous year that when the RSI indicator approached the current value (40) it then always bounced upwards and so did the price. Some analysts therefore expect a resumption of the imminent bull-run.
On-chain Analysis
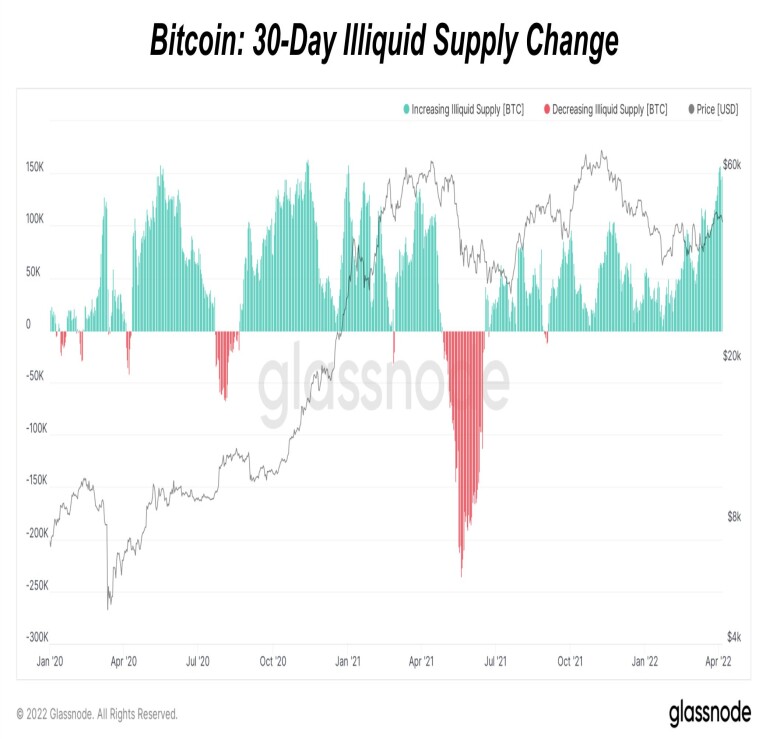
This is the most interesting and also the most complicated chapter. Analyzing the On-chain data, in fact, it can be seen how the supply of circulating Bitcoins is in sharp decline. I am not referring only to that available on exchanges' reserves, which are now at historic lows, but also to the liquid supply which is slipping to very low values. So let's start with the illiquid supply, i.e. those Bitcoins that are not available for purchase. The growth of this value indicates an ongoing accumulation by investors who, by buying at the market price, take an ever-increasing quantity of capital out of circulation. As can be seen from the graph, the trend is clearly increasing and in the last year there have been no signs of inversion, excluding only the discharge that took place after the first all-time-high. On the contrary, since the beginning of April volumes have increased and not a little, suggesting an ever greater decline in supply.
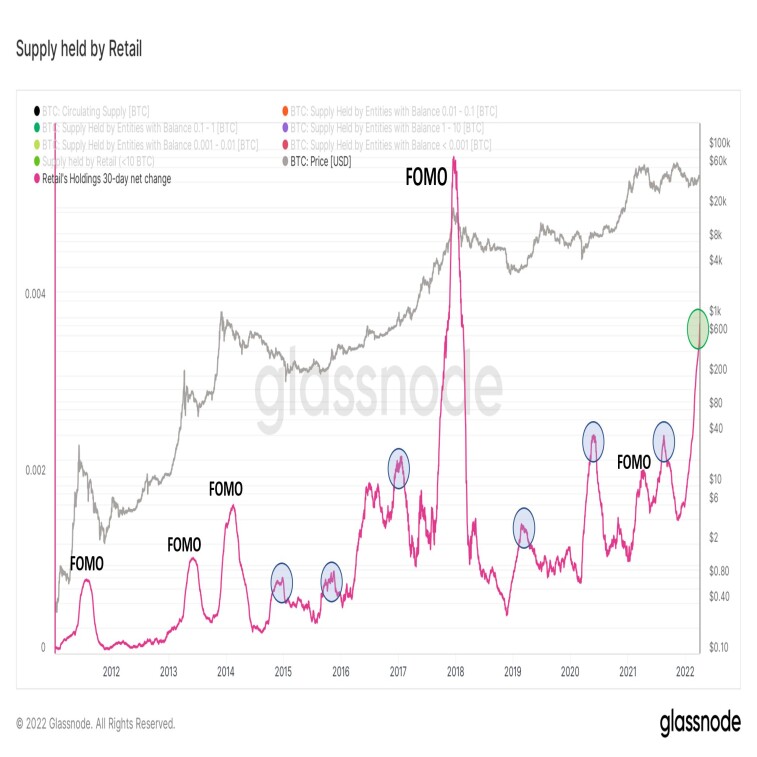
Who was the biggest proponent of this decline? Difficult to say, but retail investors have played (and are still playing) a decisive role. In fact, they returned to accumulate with volumes even greater than in the FOMO period following the last halving. The retail investor, however, is not an investor who can be "trusted", as he does not always buy to hold for a long time. Despite this, accumulation by small investors is a bullish signal because it indicates that there is confidence on their part in the markets.
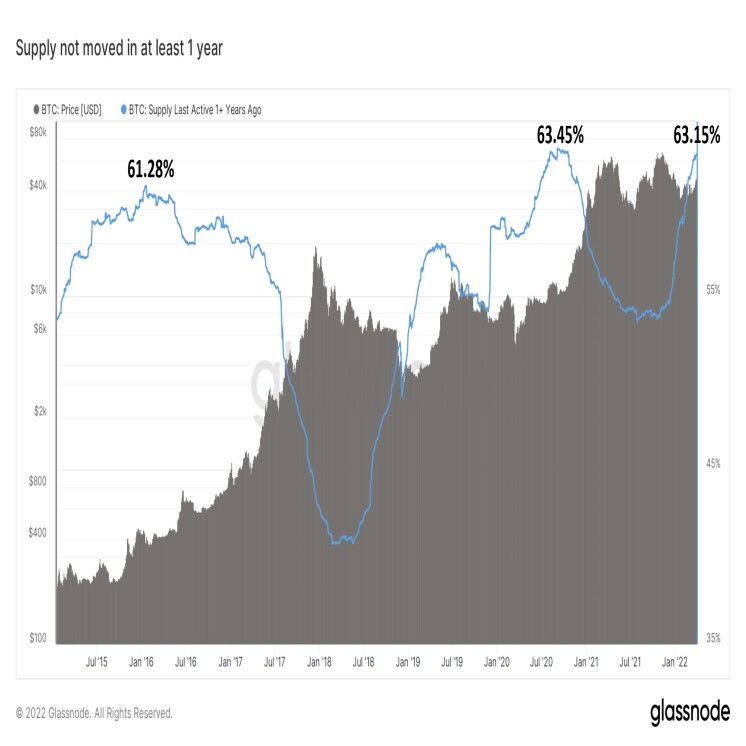
Finally, let's analyze the amount of Bitcoin that hasn't been moved for at least a year. These are medium-term holders, i.e. investors who bought a year ago, when the price was at higher levels than the current one, between $49,000 and $64,000. At first glance, this data seems positive as it may suggest a further decrease in supply. A closer analysis, however, leads to consider that these investors are at a loss and, if the price were to return to the levels at which they bought, they may want to get their money back. The level between 50 and 60k is therefore in fact configured as a large area of resistance, where there are potentially numerous sell orders for Bitcoin. However, if we want to look at the situation from another point of view, when the supply chart held by the retailers reached the levels in which it is today, the price underwent a considerable increase in the following months. The real question is therefore whether or not it will repeat itself in the near future.
Fundamental Analysis
The Miami-Conference on Bitcoin has brought numerous announcements and news that do nothing but strengthen the stable roots on which the network rests. In particular, it has begun to reveal the growth of Bitcoin's mass adoption, revealing to the world what technology it is. During the conference there were numerous announcements that had the effect of strengthening the fundamentals of the network, including that of the collaboration between Strike and three large payment services (Shopify, NCR and Blackhawk) to allow payments in Bitcoin in the shops of the United States. In addition, discussions were held on how to make this cryptocurrency legal tender in other cities such as Prospera (Honduras) and Madeira (Portugal), as well as Lugano and the state of El Salvador.
Conclusions
What can be deduced from the analyzes is that the On-chain and background data on Bitcoin are bullish over the long term, but the technical analysis brings us back down to earth. In fact, it outlines a bearish picture in the short term, also confirmed by what this analyst claims:
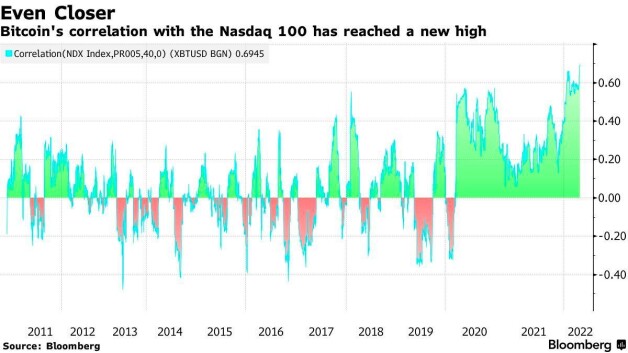
In fact, the "weak hands" are the ones who need to pay more attention to during this time because their intention is to sell in order to monetize. These are people who certainly did not understand much about Bitcoin and appreciate the old FIAT currency more. Precisely this type of investor is the one who sees Bitcoin only as a speculative instrument, on which to "park" liquidity a wait for it to grow. This seems to be a growing trend lately, as those who have known this technology during the last few years have not explored it and used it as an investment like classic finance. Emblematic is the correlation between Bitcoin and the Nasdaq100, which since 2020 has marked all-time-highs:
Read Also:
Not yet subscribed to Nexo.io? Use this link to get a $25 bonus in BTC.
If you liked this article, please support me by following me here and on Twitter, leave me a like or use one of my referral links below. 👇
-Thank you-
➡️ Join Celsius Network using my ref & earn $50 in BTC
➡️ Use BlockFi and get up to 4% on Bitcoin. Read here how to do


