Bitcoin had four major trend reversals since October 2025.
- October 6, 2025: The market cycle top that preceded the infamous October 10 crash
- February 6, 2026: The local bottom that preceded a 3-month-long relief rally
- May 6, 2026: The local top that ended the 3-month-long relief rally
- July 1, 2026: Our recent bottom at $57,800
In this article, we’ll go over every single one of these reversals and look at the exact pattern that predicted them all.
The trend channel rule
The pattern I’m talking about is called the "trendline rule" or "trend channel rule". It says that once price has broken out of an established trend channel, we first expect one final push to a new lower low in a downtrend or a new higher high in an uptrend. After the new extreme has been established, we expect a correction or reversal.
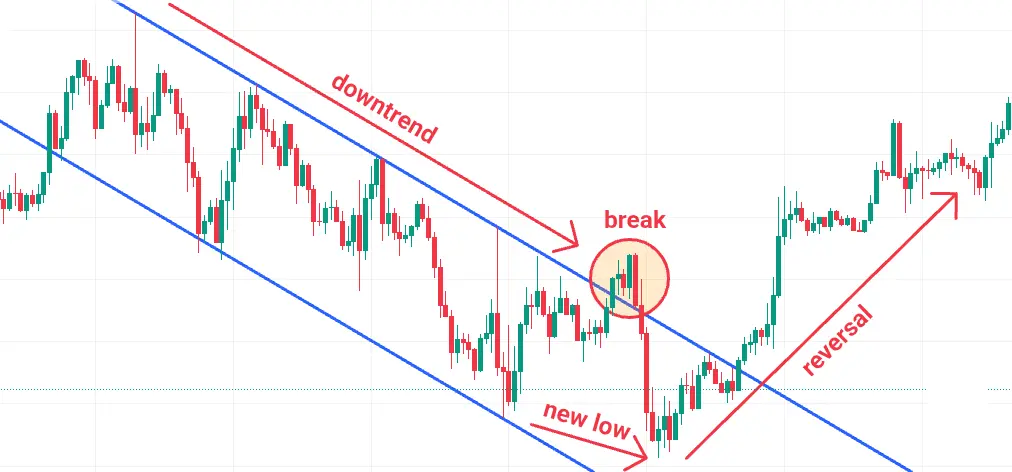
The final push to a new extreme can be a single-legged or a two-legged move.
Please note that the trend channel rule alone doesn’t guarantee a reversal if the market context doesn’t favor it. The trend channel rule is not magic but merely a tool to identify exhaustion of a trend. Because of that, we’ll look at the context for each example as well.
October 6, 2025
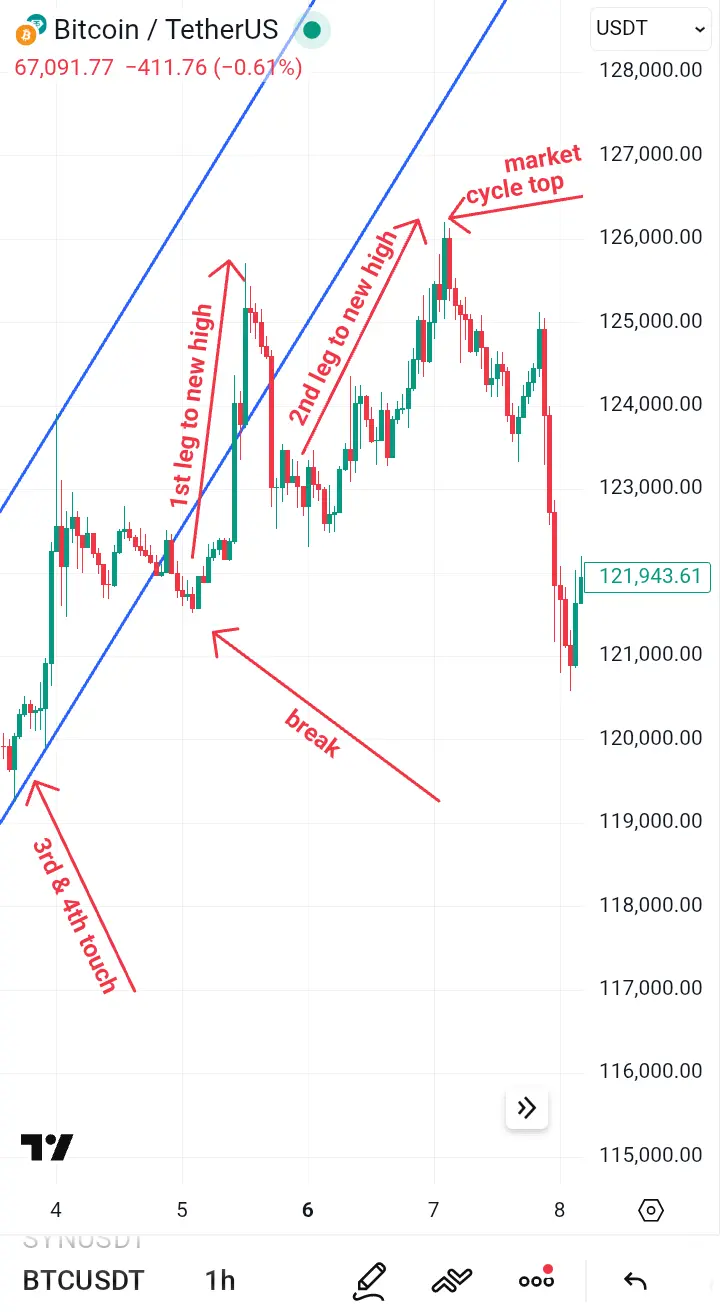
This was perhaps the cleanest of all reversal patterns because it appeared on two different timeframes simultaneously. A wider uptrend channel, clearly visible on the daily timeframe, played out with the break and push to a new high.
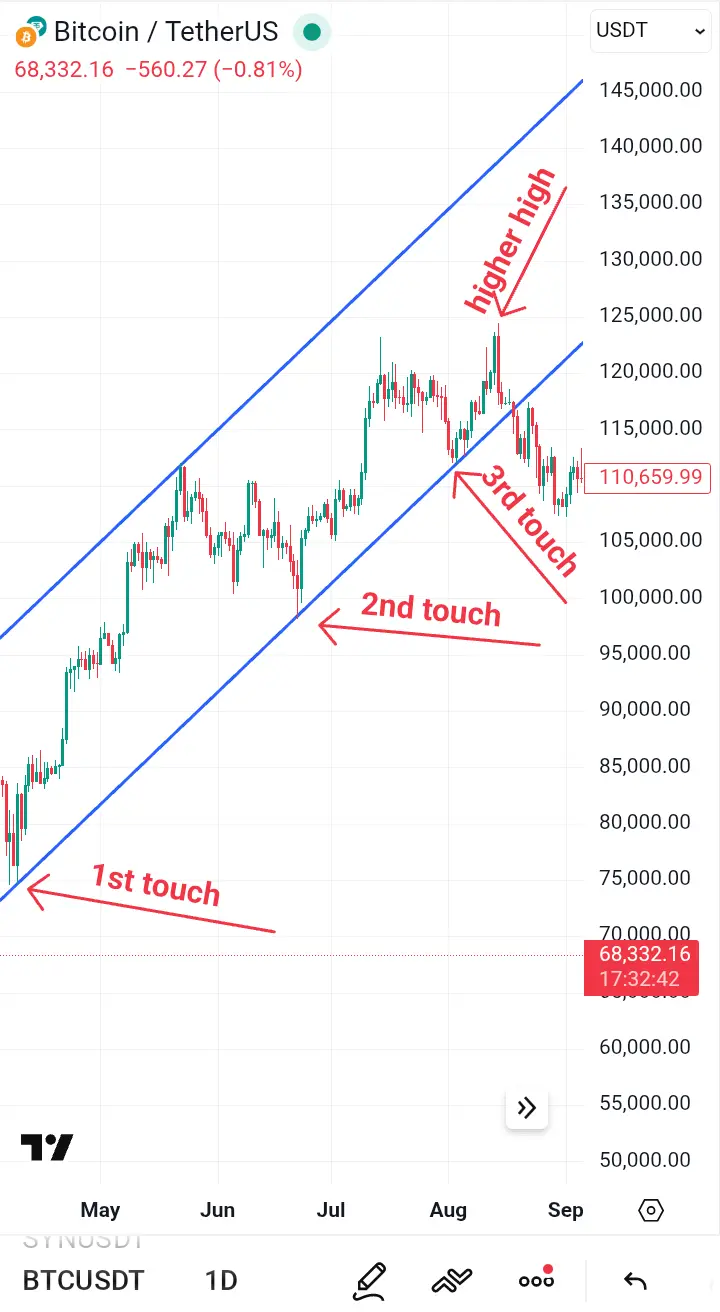
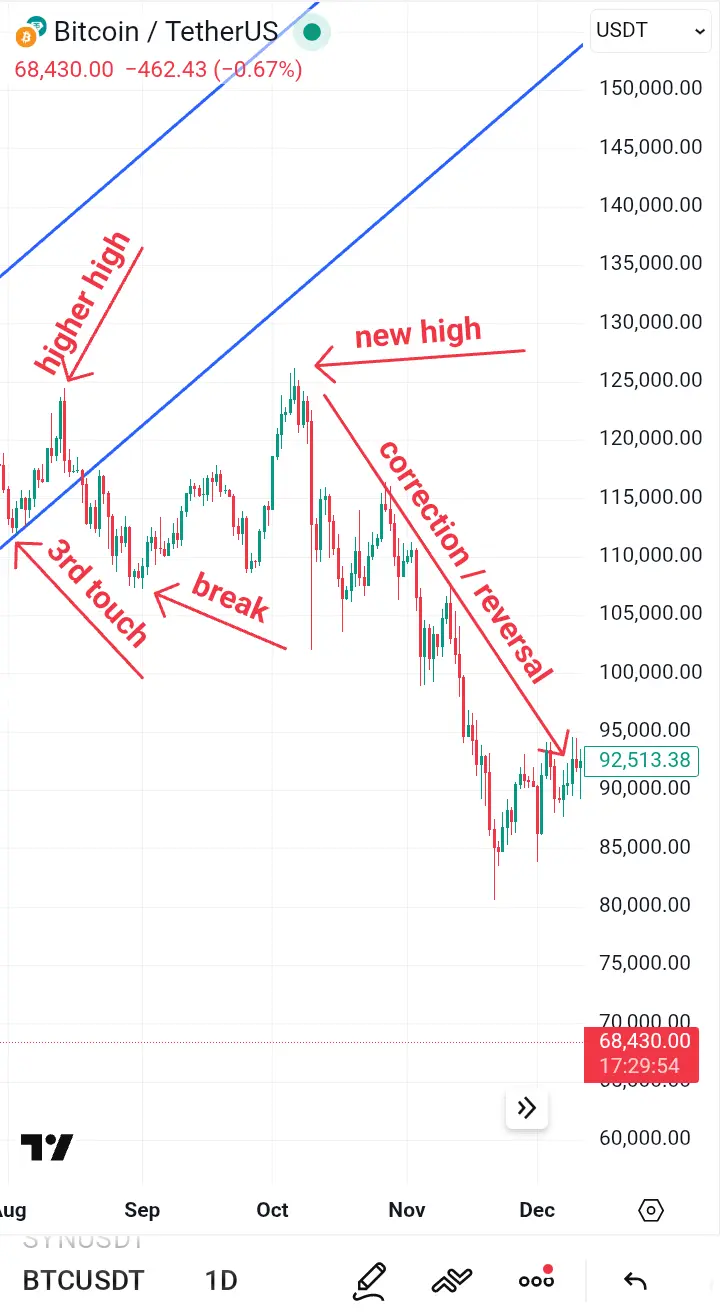
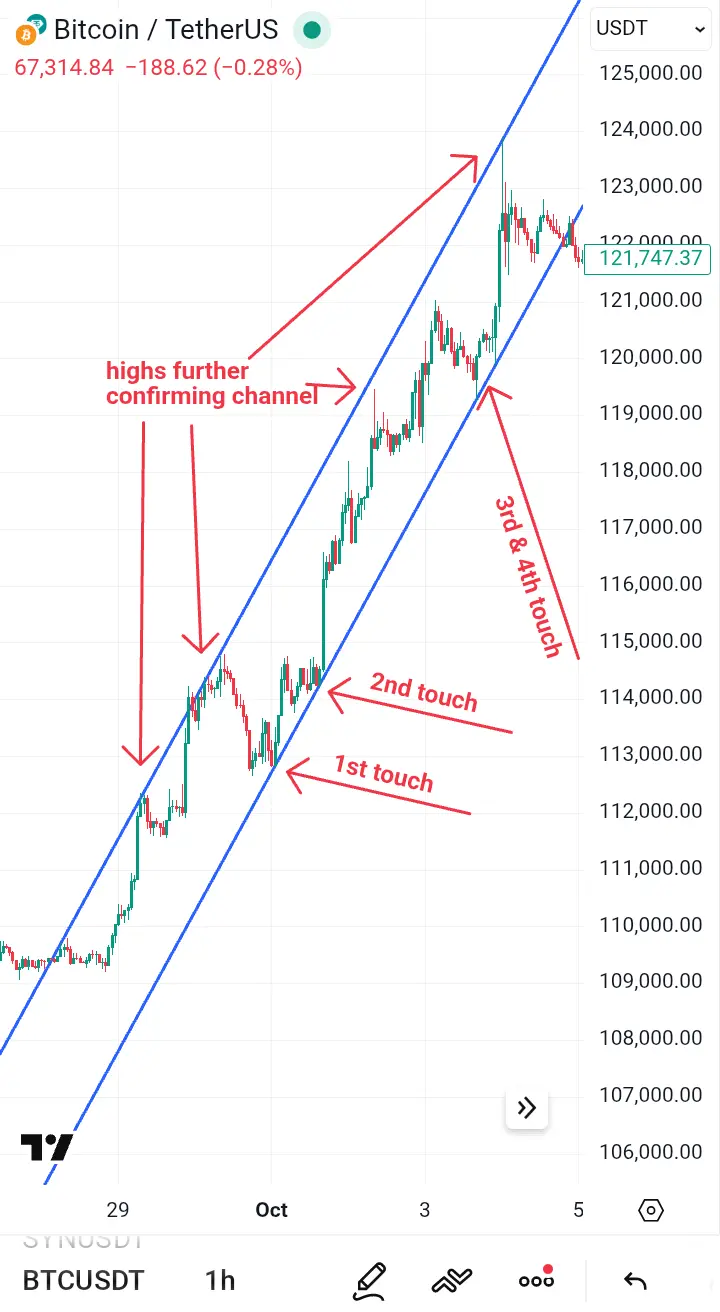
At the same time, a shorter-term uptrend channel, visible on the hourly timeframe, also played out with the break and two legs to new high at the same time.
Context
The fact that two channels played out simultaneously is already a very strong case for an impending reversal context-wise.
In addition to that, the top appeared exactly 152 weeks after the previous bear market bottom. With two previous bull markets also lasting exactly 152 weeks each, the context very much favored a reversal.
February 6, 2026
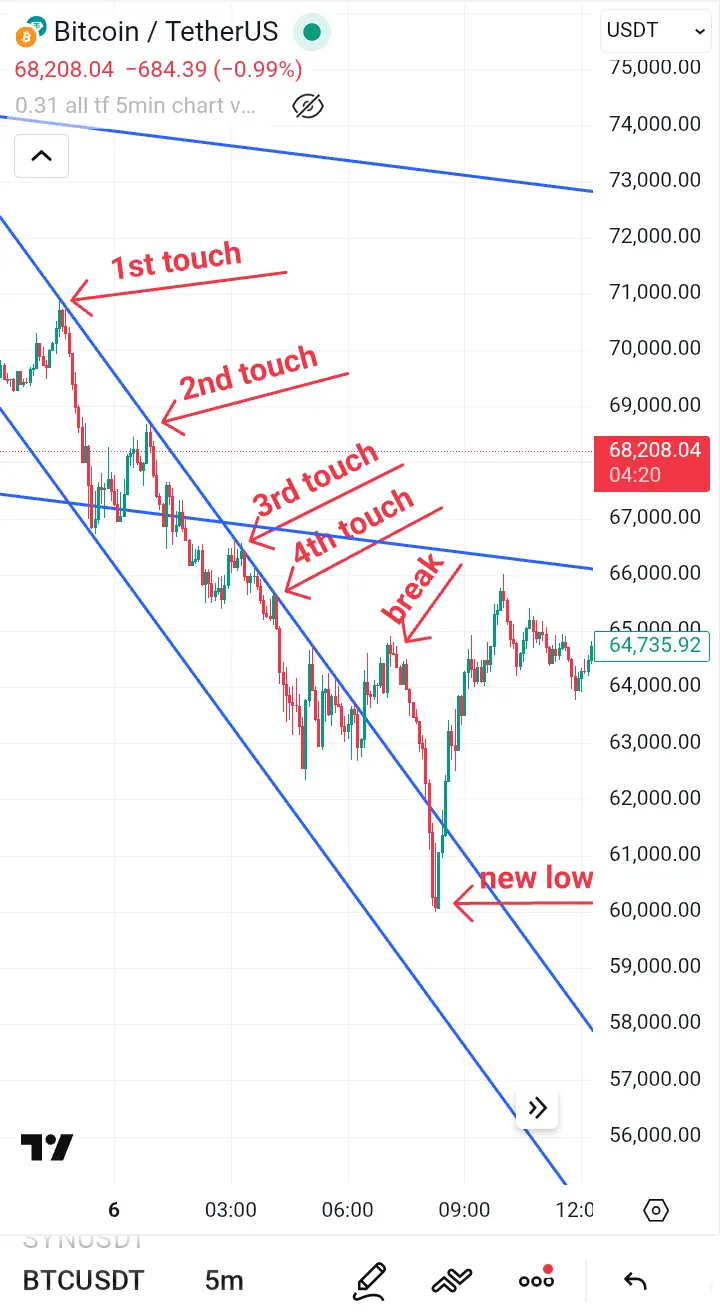
At this point in time, there were multiple channels in play again. There was a strong downtrend channel working lower, clearly visible on a 5-minute timeframe. That channel had a break, followed by a push to a new low, after which we expect correction or reversal.
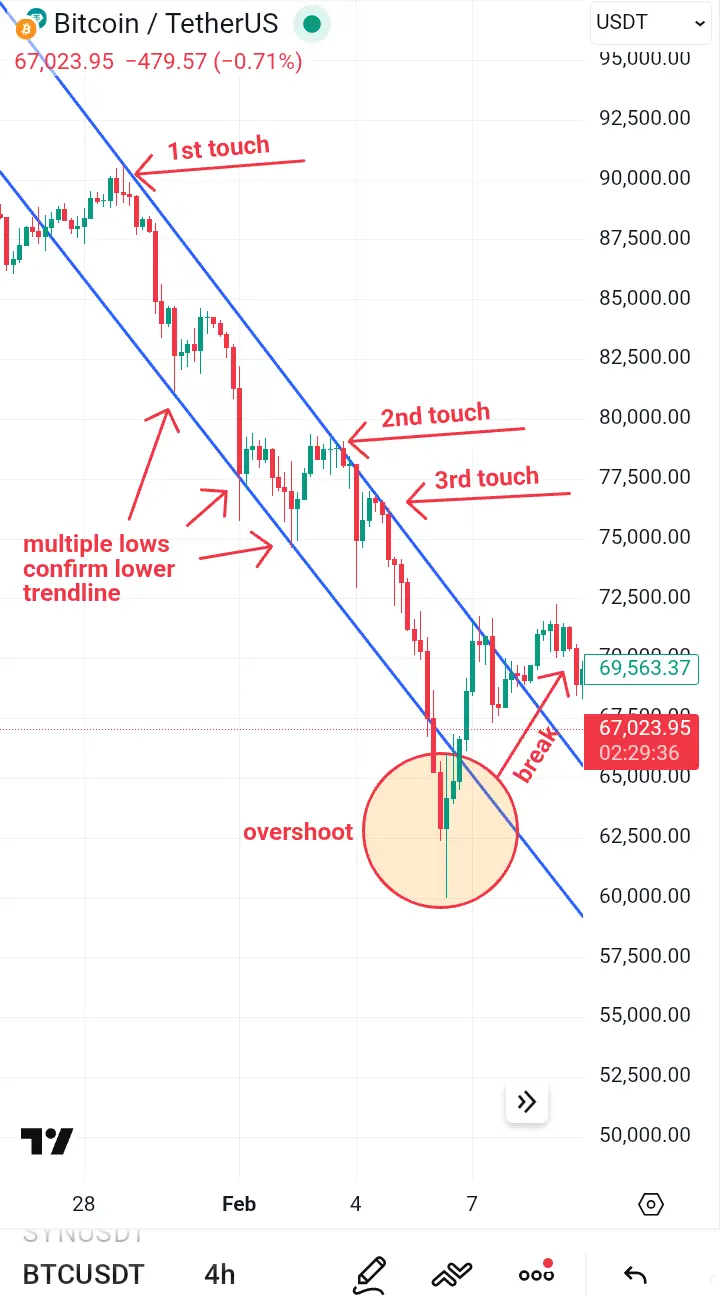
At the same time, there was a wider downtrend channel in play, clearly visible on a 4h chart, that had overshoot. There is an additional rule considering overshoot. When price overshoots a well-established trend channel, we expect stronger momentum in the opposite direction and a break of the trend channel.
Context
Again, we had confluence with multiple channels. The short-term channel showed a reversal pattern, while the wider channel had overshoot, which, according to price-action rules, leads to stronger momentum in the opposite direction, in this case to the upside.
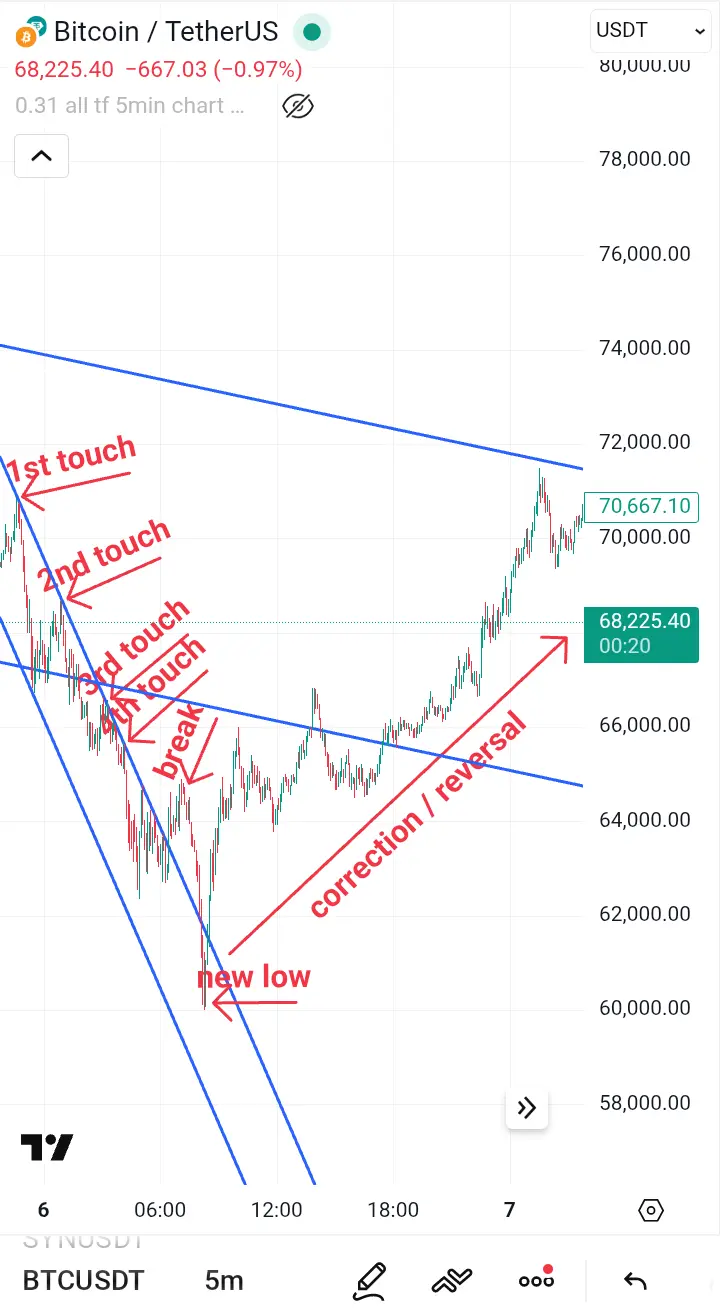
At the same time, price just tested a key price level, the 60k area, where many traders expected a strong bounce or longer consolidation anyway.
May 6, 2026
An uptrend channel, visible on a 4-hour chart, has been slowly working higher for quite some time. It was a rather weak but consistent uptrend with many confirmations of the channel at the lows as well as the highs. As expected, after the break, price went for a final rally to a new high, where it nicely found resistance at the 200-day exponential moving average and the trendline that previously acted as support. After that, it reversed back down as expected, and the bear market continued.
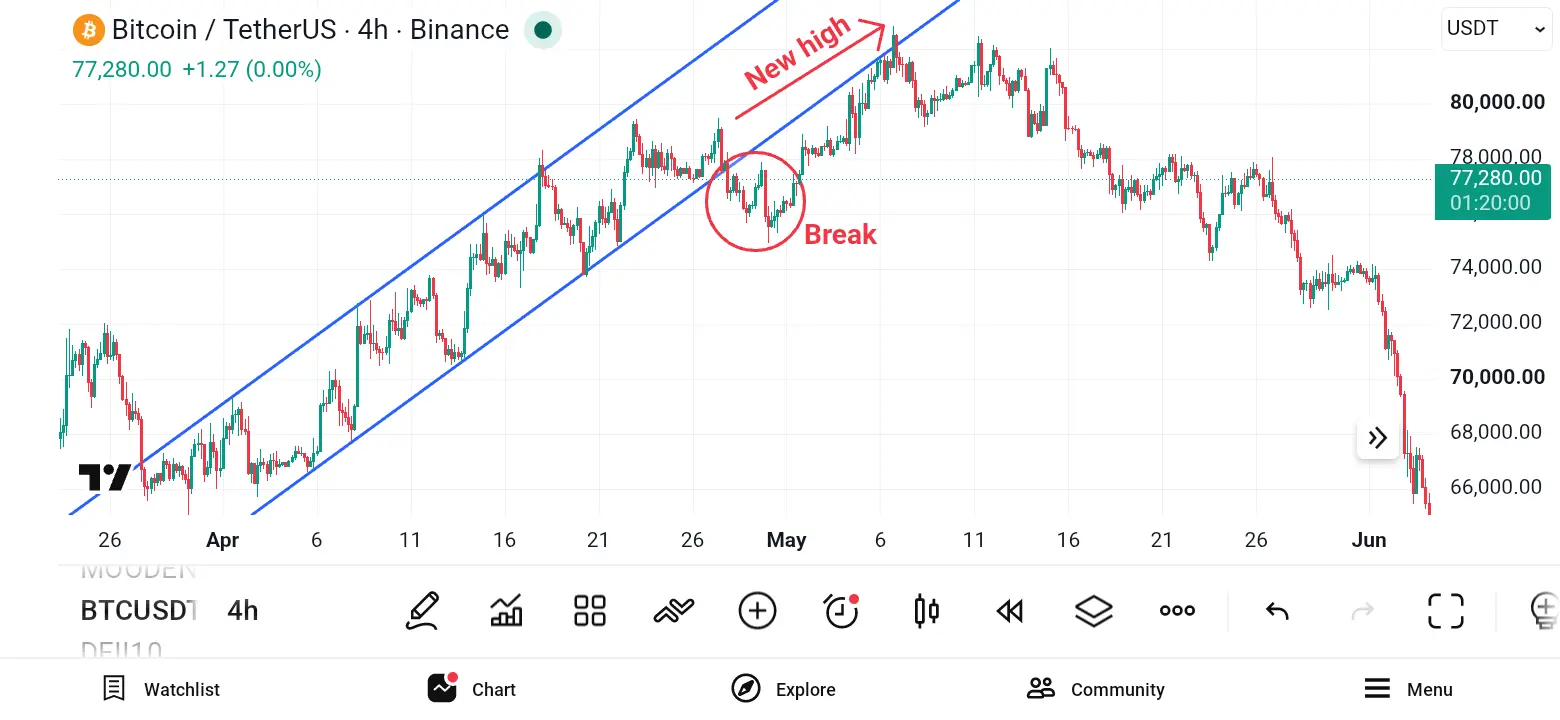
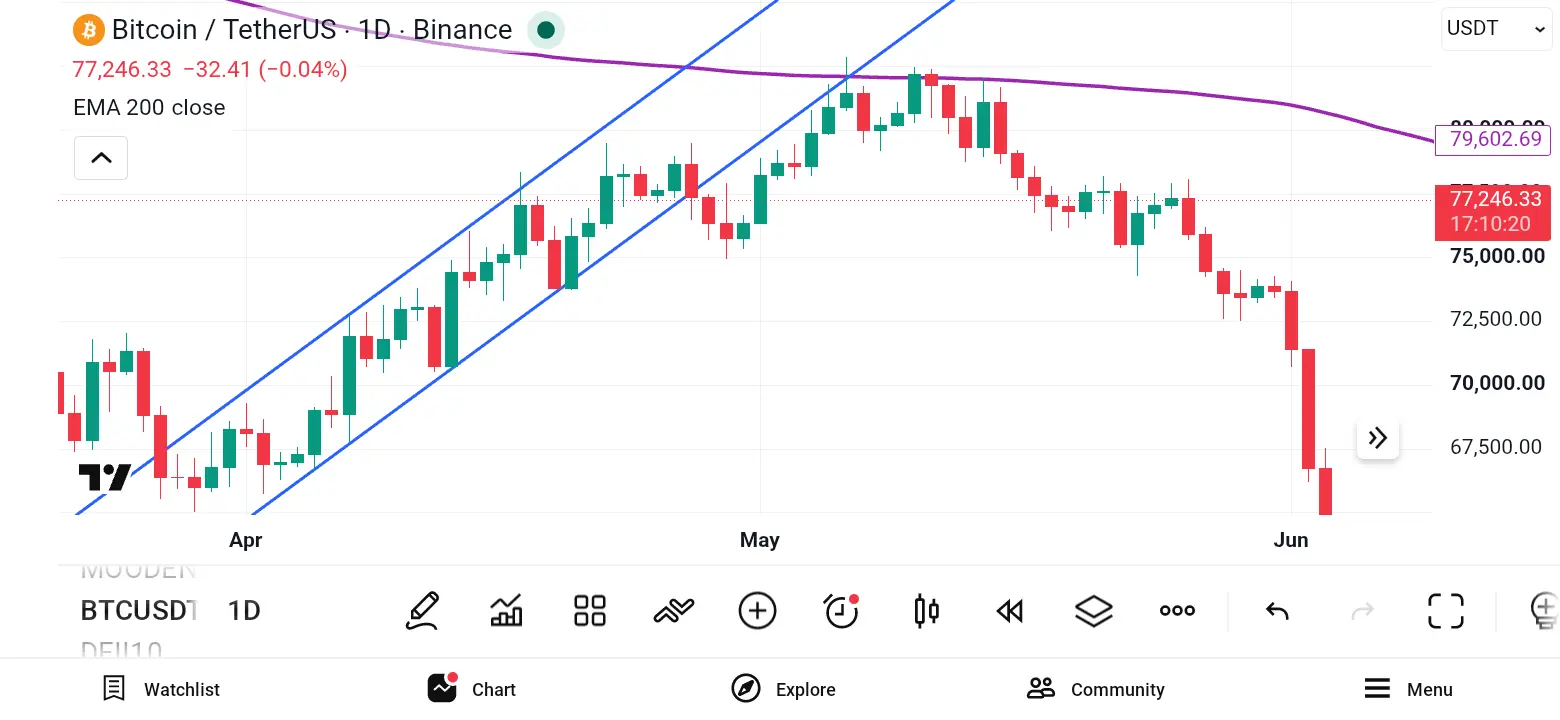
Context
This time, we only had one channel showing a reversal pattern, but the context was still bearish. Bitcoin was in its typical bear market, and there was no bullish divergence at the February lows on any higher timeframe. This indicates that an additional leg down was highly likely.
The global M2 indicator with a 75-day lag also hinted at further downside into June. This indicator often nicely correlates with Bitcoin, during bear markets often only with the sell-offs.
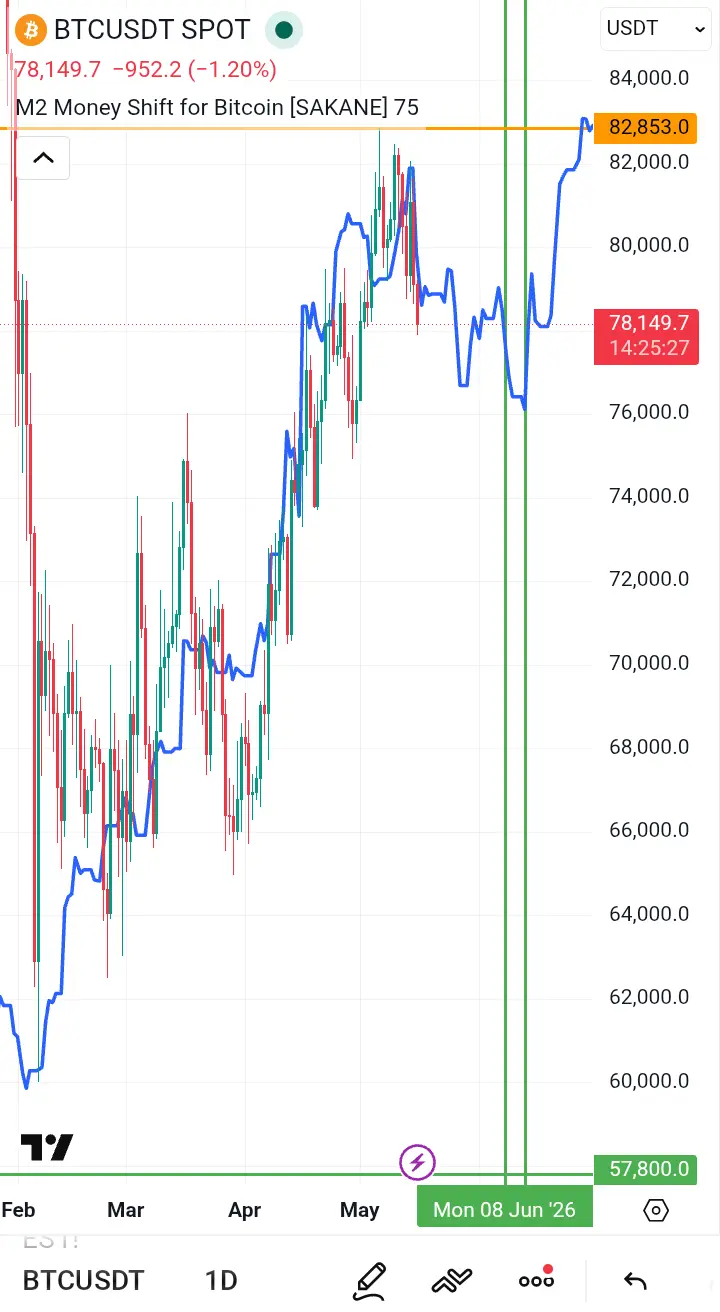
Leverage traders who don’t understand the trend channel rule will continuously have their stop losses triggered
After price first broke down from this channel, the sentiment on Crypto Twitter immediately flipped bearish. Everyone started jumping into short positions prematurely, not knowing that the previous channel still needed a new high to be retested after the break. The subsequent push to new high forced them out of their short positions again, making them lose money.
Then at the new high everyone flipped bullish again, calling the bear market over and jumping into longs, not sensing the danger that the uptrend had actually played out at that very moment, after the break and new high.
July 1, 2026
Bitcoin has been trending lower inside a downtrend channel clearly visible on the 4-hour timeframe. Again, the channel broke and price crashed down to a new low shortly after, from where it bounced strongly and reversed back up in no time.
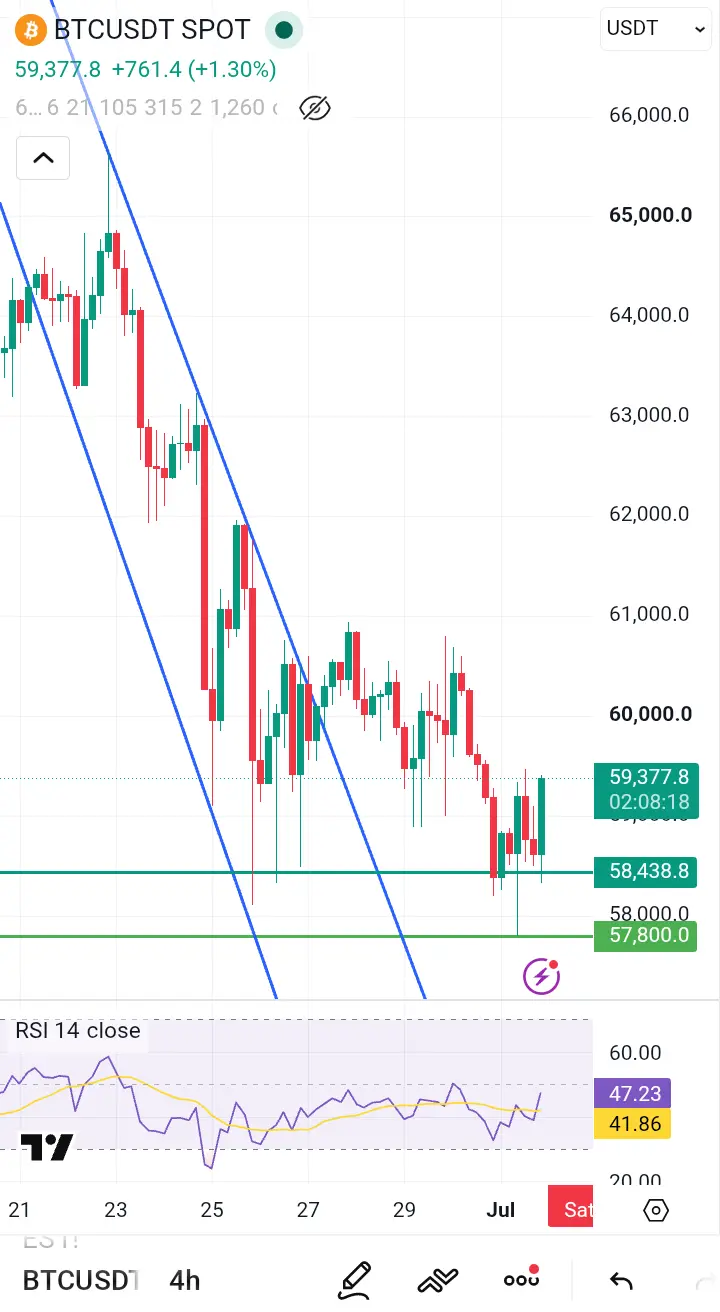
Context
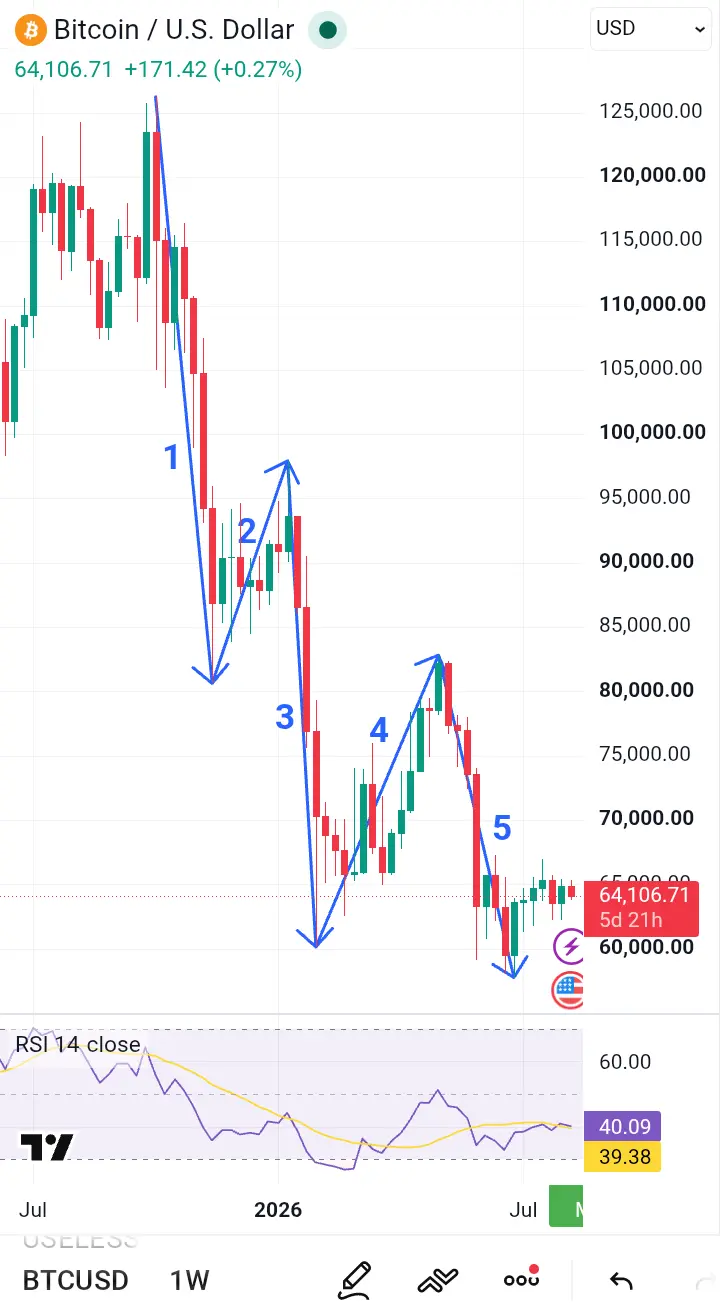
This time, there was strong bullish divergence on both the daily and the weekly timeframe. At the same time, Bitcoin was already in its fifth wave to the downside within this bear market.
Up to the moment the downtrend channel broke, price had not yet touched the 0.618 Fibonacci retracement level found from the bottom to the top of the entire previous bull market.
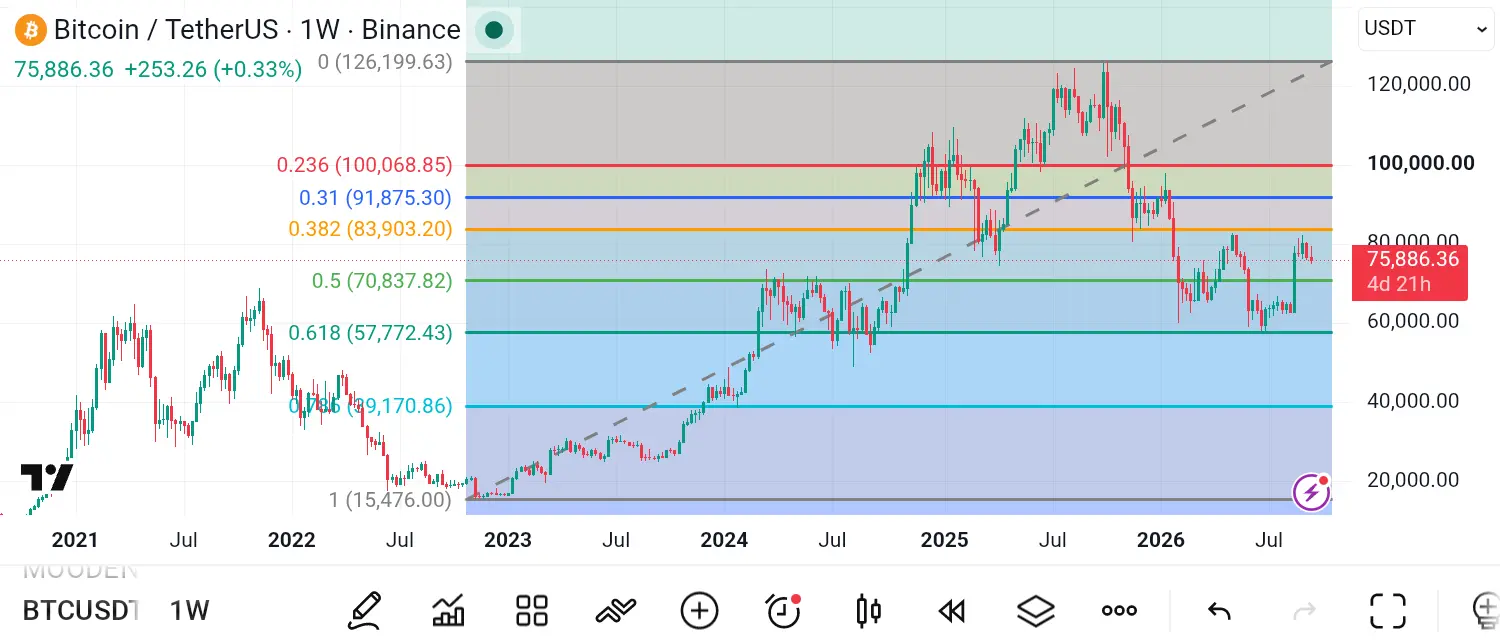
This final crash to new low would coincide with the very first touch of this very important level at $57,800. Given that the downtrend channel already played out with a break and new low, I was sure that price would not just continue lower after touching this important level for the very first time, but it would strongly bounce off of it.
While everyone on Twitter was calling for 52k, 48k, or even 30k Bitcoin, thanks to knowing price-action rules, I was able to calmly place my limit buy order at $57,800. I was also able to publicly announce this bottom on my Twitter account (@CryptopusCharts) over a day before it occurred.
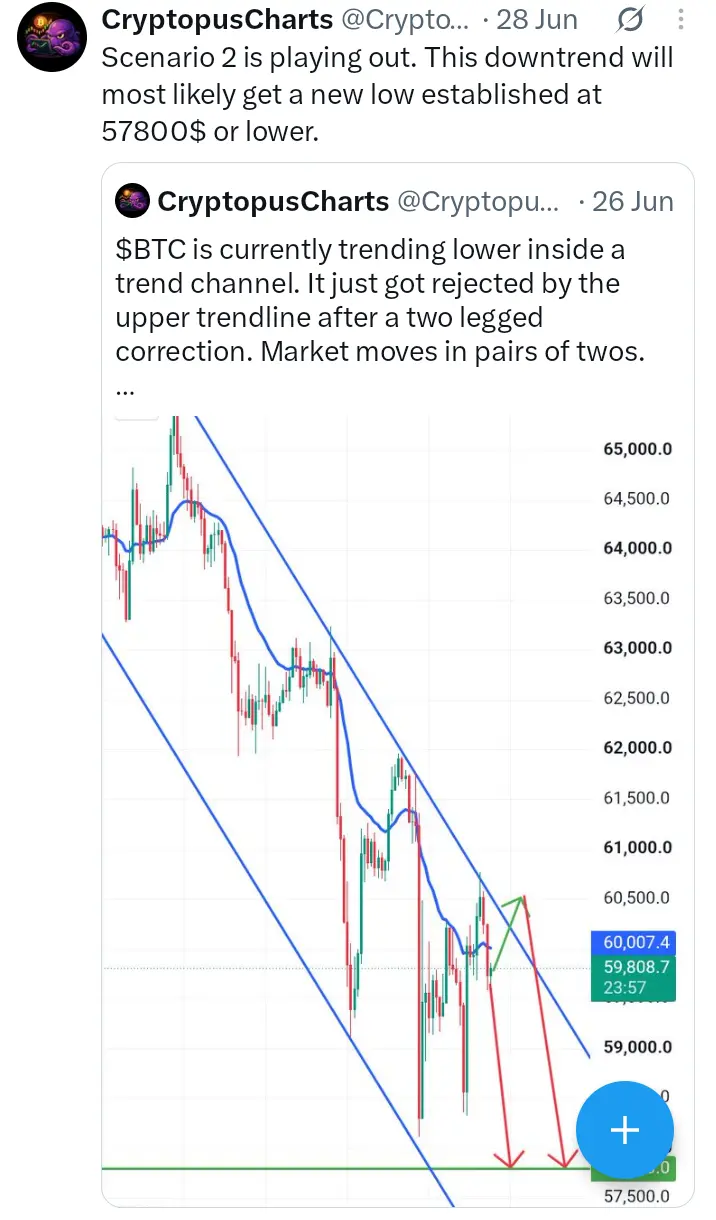
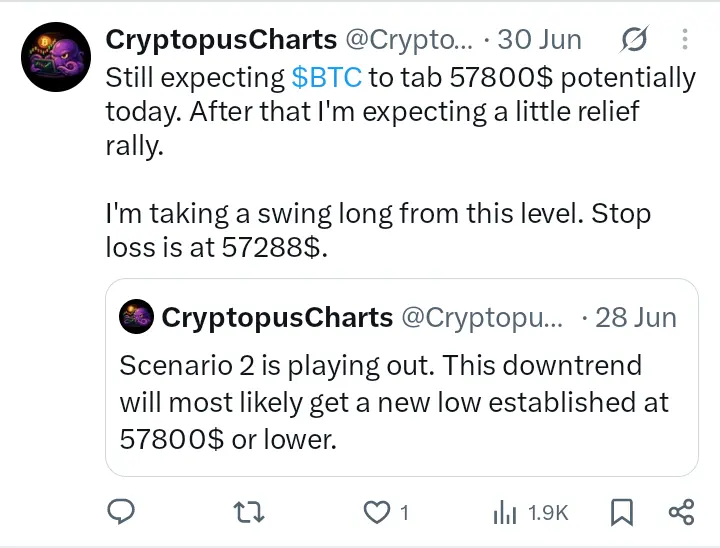
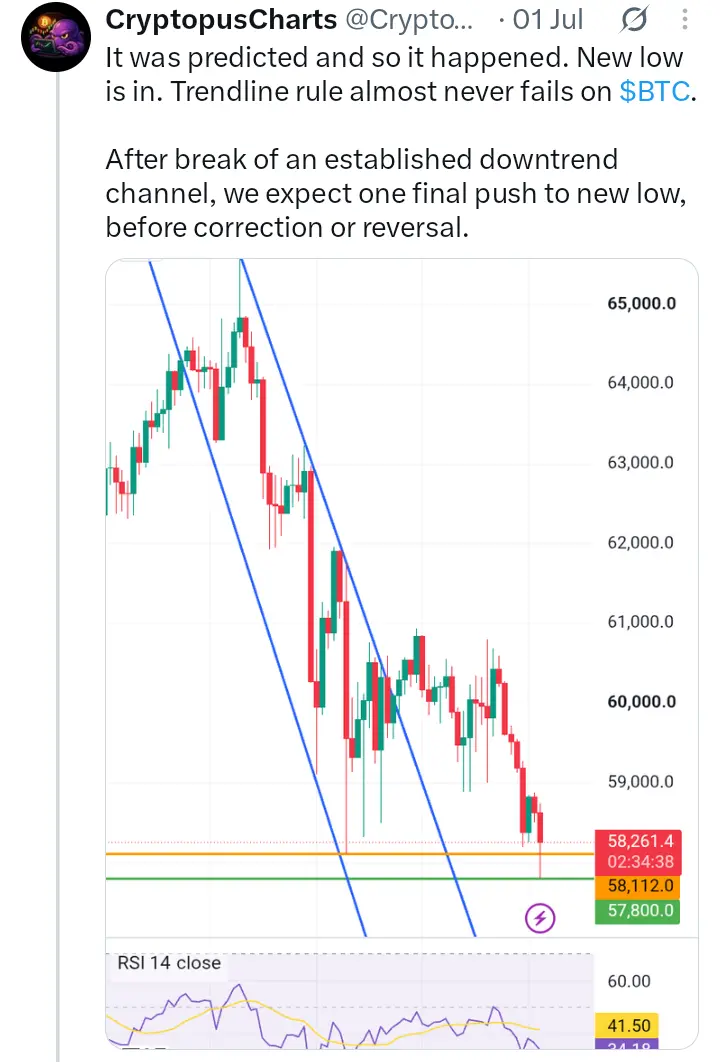
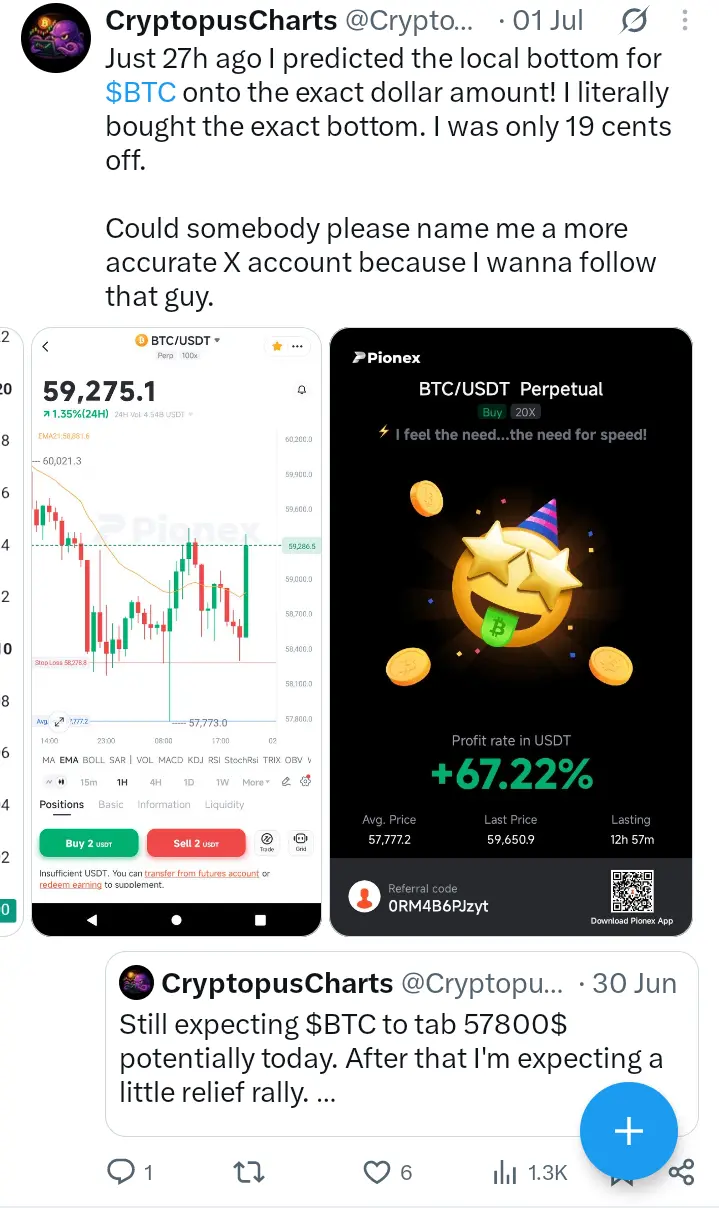
This is proof that the trend channel rule helps predict future price movements before they happen and doesn’t only fit nicely in hindsight.
A little bonus: XRP’s recent bottom
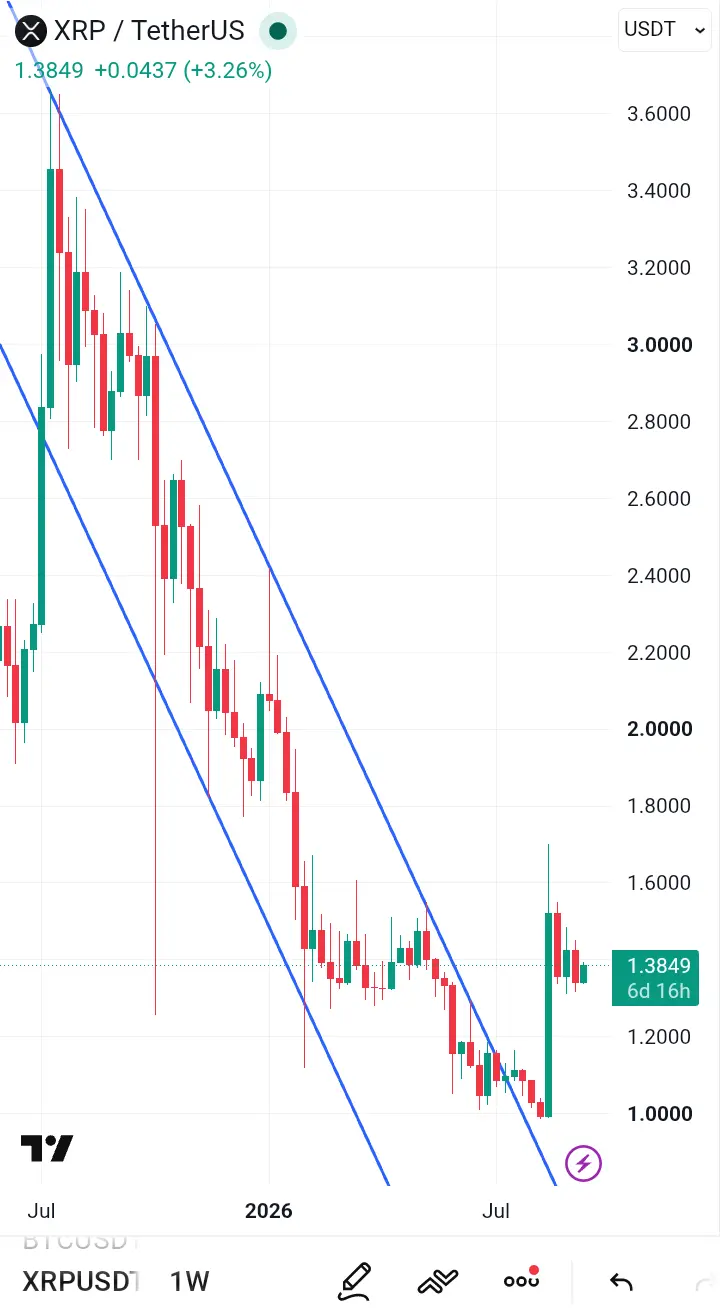
Take a look at how nicely the trend channel rule called this recent XRP bottom just below $1.
Final note
Please keep in mind that the trend channel rule only applies to valid channels. For a channel to be valid it needs at least 3 touches at the lows in an uptrend or 3 touches at the highs in a downtrend. Every touch must be followed by a new extreme before the channel breaks, for it to be valid. Also the two trendlines that form the channel must be parallel.
If you made it this far, congratulations! You now have one more tool in your toolbox that may help you outperform most other traders. Good luck!
If you want to trade crypto, you can do so on the exchanges I’ve been trading on for years.
Pionex is an exchange that specializes in trading bots, although manual trading is also supported. Using this link to sign up will grant you 5% discount on all trading fees. I may also earn a small commission at no extra cost to you. Alternatively, you can enter the referral code 0RM4B6PJzyt manually during sign-up.
Trade anonymously on LBank, a well-established crypto exchange without mandatory KYC verification. Using this link to sign up will grant you 5% discount on all trading fees. I may also earn a small commission at no extra cost to you. Alternatively, you can enter the referral code 5UABD manually during sign-up.