
Solana continues to bounce below $50 and bearish trends remain strong. What can happen with Solana and how are we expecting a recovery?
In today's article, we are going to analyze the current situation of Solana and make estimations on how its price will continue moving.
How is Solana trading?
During the last months, Solana has performed away from its ATH which relates to the constant power of the bears and the general shape of the market. SOL was trading around $80-100 by late February and it began rallying in late March, almost reaching $140. Since then it has experienced a continuous downfall by falling below the $95 level and creating a new area of resistance ($85-95).
SOL dropped to $40 as a result of the Terra collapse and the Fed's policies regarding inflation, notably the increased interest rates. It's currently bouncing around the $40-45 zone.
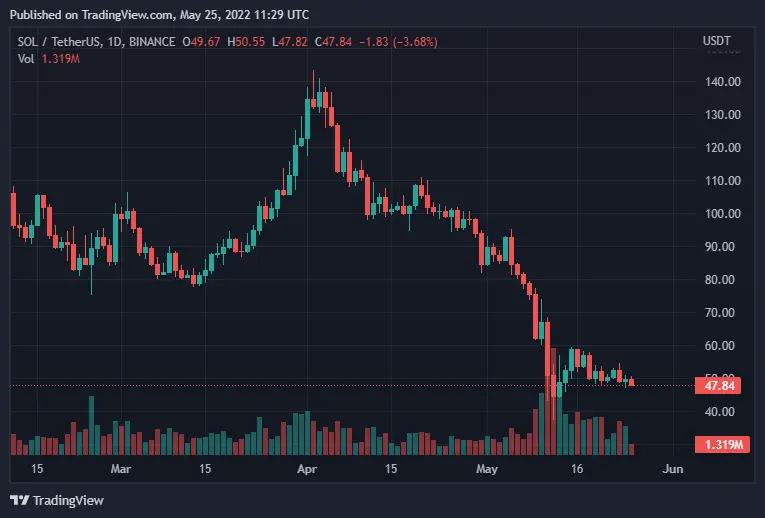
TradingView chart showing SOL/USDT pair as of 25 May 2022.
Win $2000 by participating here!
Some indicators for the future.
It's worth opening up some indicators to track down strength and volatility.
Since April, the RSI (Relative Strength Index, used to show the strength or weakness of a trend) has been below the neutral 50 level, indicating a bearish trend. The RSI is still around 40, therefore nothing has significantly changed.
The MACD (Moving Average Convergence Divergence, used to reveal the strength, direction, and momentum of a trend) was also below the 0 line, showing that momentum is still bearish. However, the MACD line (blue) established a bullish crossover above the signal line (orange), indicating a pullback that could be followed by another leg downward.
Last but not least, the OBV (On-Balance Volume, used to relate price and volume based on buying and selling pressure) has made higher lows in recent weeks, but it has been unable to regain the selling volume seen earlier in May. As a result, demand for Solana was not high enough to warrant a chart comeback.

TradingView chart showing SOL/USDT pair with additional indicators (RSI, MACD, OBV), published on 25 May 2022.
Bear in mind that this week's volatility is predicted to be very high. On May 24, data on new house sales was set to be released, today data on durable goods, and in the upcoming days, a GDP growth rate report and personal expenditure and income (MoM) are following suit.
Want to win outstanding rewards? Join here!
Conclusion
The main reason contributing to the price evolution of Solana is Bitcoin, as its volatility continues to influence the fate of other currencies. If it reaches $35,000 Solana can likewise recover otherwise I wouldn't phase out a further decline in price. Possible support zones could be around $20-30 this time.
That's all I had for today. I hope you enjoyed the article and appreciated the effort. Do you hold SOL and if yes what do you think about the current downtrend? I am thinking about buying some if it continues falling because it has outstanding features and I believe it can record great returns.
Crypto means freedom and responsibility. Invest wisely!
Important links:
Registration links:
- Sign up in Binance and win an NFT!
- Get up to $40 as a registration bonus in CakeDefi!
- Earn diamonds with me in CoinMarketCap!
- Earn free ZEN in Horizen!
- Earn free ASK in Permission!
- Earn free 1FLR, MATIC, and ZEC in PipeFlare!
- Sign up in XT.COM and trade selected currencies!
Social Media:
- Discord: CryptoChad#2416
- Medium: @cryptochad2
- Reddit: u/CryptoChad2
- Twitter: @cryptochad_v2





