
There are many different indicators that you can use in charts in order to better analyze the charts and prices of stocks/cryptocurrencies.
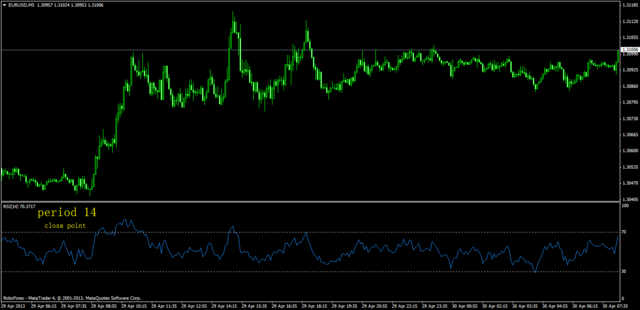
One of the most basic indicators every technical analyst uses is called RSI (Relative Strength Index). RSI is basically showing you whether the price of a stock is overbought or oversold. The normal RSI that everybody uses has 2 different critical levels. The first one is 70 and the second one is 30. The RSI line bounces between those levels along with the price of the stock you look at. When the RSI is touching the 30 level then it means that the stock you are looking at is currently oversold. This means that there were many sell orders despite buy orders and it caused the price to drop to a low level.
When the RSI line touches the 70 level then it means that the stock is overbought. That means that there were many buy orders despite sell orders which pushed the price to go higher into a very high price compared to the normal price range.
What is the strategy for RSI?
When using RSI to analyze a stock, we should look first at which timeframe we are looking at. If we are looking at daily candles chart then the RSI indicator will only be focused on the daily chart. However, if you change it to an hourly chart then the values will be completely different!
The most used strategy of RSI is to buy something when the RSI is below the 30 levels as it means that the stock is oversold, and then it has a potential to get back to its original price, or you can do the opposite with short and buy a stock when the RSI line is over 70 in its value.
Of course, you will have to combine RSI with other indicators to better analyze stocks/cryptocurrencies. You CAN NOT rely only on the RSI indicator! However, it gives you a piece of critical information in order to better estimate what is going to happen next with the stock you are interested in.
----------------------------------------------------------------
DID YOU ENJOY READING MY POST? FOLLOW ME TO STAY UPDATED!


