
Those who have been following the Bitcoin price for that past few days have seen significant price changes. The price of Bitcoin was around $8000 last week and dropped just in ONE day to the $5000 level. After a few more hours it even dropped to the $4400 level which is an extremely oversold area for the current time of BTC.
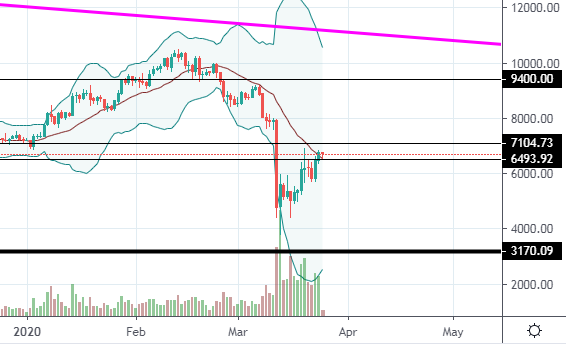
By looking at the BTC chart, we can clearly see that it has almost hit very strong support which is around the $3000 level.
To be honest I was thinking that this is the end of BTC and many other people sold their Bitcoin in this massive bear market. However, I am still optimistic as the long-term chart looks promising. Much promising than investors think that it could be.
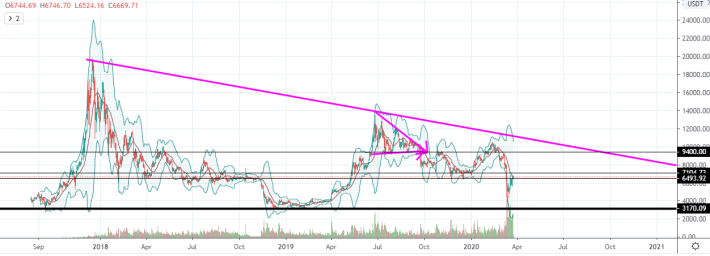
From looking at the longer-term chart we can see that there is a forming triangle that "restricts" the Bitcoin price from any massive moves.
And from a quick look, we can see that the triangle is getting smaller as time passes. Therefore at the end of the triangle (or even before that), we will see a massive move of the BTC price when it will break the triangle.
Usually, when a chart breaks such a strong triangle as we have in this example, it is being done with a VERY BIG volume. Therefore, we can expect a big move in the market once it happens.
To conclude, I think that BTC still worths a hold but not a buy at the moment.


