
I ignored this pattern for a long time. It seemed like just another Twitter scare story, another “expert” predicting a crash every year hoping to be right someday.
But then I dug into the data myself. And it got uncomfortable.
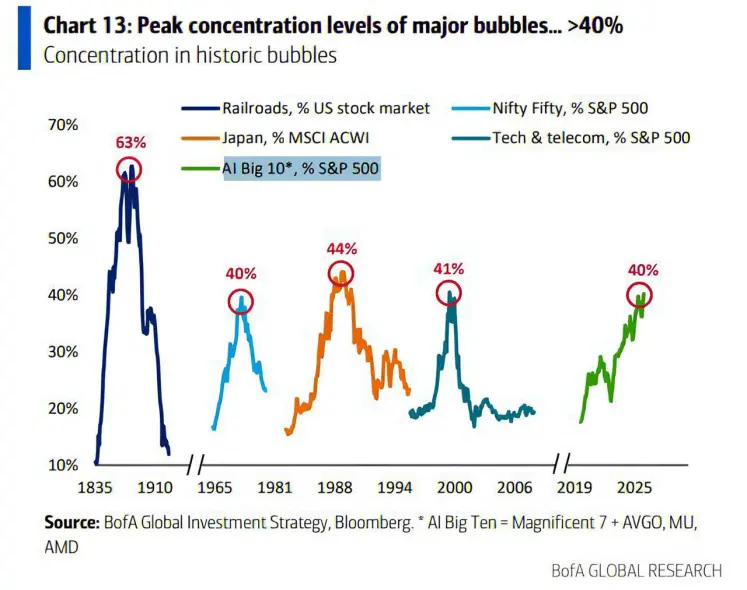
The rule is simple: when the top 10 stocks account for 40% or more of the entire market, something unpleasant has always followed.
In 1929 — 44%, then the Great Depression. In 2000 — 41%, then Nasdaq down 80%. Today — 40% again. Apple, Microsoft, Amazon, Nvidia, and Google alone make up 25% of the entire S&P 500.
This is not just a number. It means the market is resting on five companies.
People ask me — “so what, these are stocks, what does this have to do with crypto?” Well, in 2022, when the S&P started falling, Bitcoin crashed from 69kto69kto16k in a few months.
Not because something broke inside crypto — it’s just that risk assets get dumped all at once when big money moves to safety.
I myself thought in 2021 that crypto lived in a parallel dimension. Then I watched it correlate almost perfectly with every sneeze of the Nasdaq.
Does this mean everything will collapse tomorrow? No. The pattern speaks about risk, not a date. In 2000, several months passed between reaching 40% and the actual crash.
But here’s what matters: the 40% concentration is not a warning for traders. It’s a warning for those who hold everything in one basket and expect it to just grow on its own.
Diversification is not cowardice. It’s survival math.






