
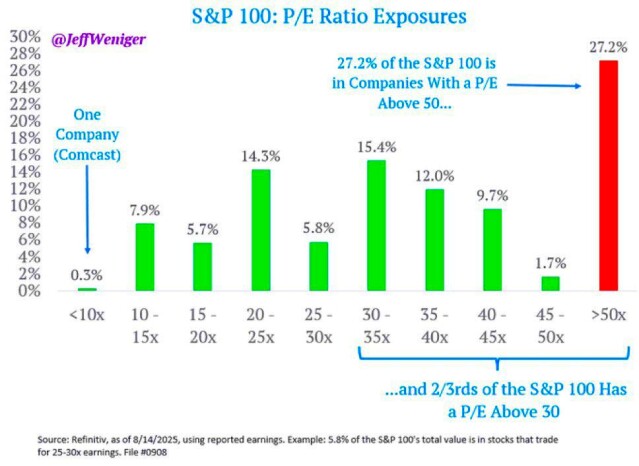
Take a look at the chart: nearly a third of the companies in the S&P 100 index are currently trading with a P/E multiple above 50. And two-thirds are above 30. This means investors are paying for decades of future profits right now, as if the money will flow forever.
At first glance, this looks like a celebration of optimism: the market believes in these companies, their future profits, and growth. But if you dig deeper, it becomes clear that the driver of this growth is not business efficiency, but a sea of liquidity and record buybacks. The actual profitability of companies with such valuations simply can't keep up with their share prices.
Imagine a house that costs three times more than its neighbors simply because the city has cheap credit and people are actively buying up real estate. The house itself hasn't gotten any bigger, the roof still leaks, and the heating works intermittently. That's exactly what the situation in the stock market looks like today.
According to Refinitiv data for August 2025, the index structure looks like this:
• Only one company (Comcast) has a P/E below 10.
• The largest share—27.2% of the index—is companies with a P/E above 50.
• 66% of the S&P 100 is trading for more than 30 times annual earnings.
What does this mean? Such valuations rarely last forever. History shows: the greater the gap between price and real profits, the more painful the correction. Remember the dot-com bubble: back then, it also seemed like the "new economy" justified any multiple.
The key idea: markets today are moving not on the logic of fundamental value, but on flows of liquidity. As long as there are buybacks and cheap money, share prices will rise. But as soon as the tap is turned off, the air will start to leak out of the bubble.
Question for you: do you think we are already in the final stage of the bubble, or is there another leg up still to come?


