- Bitcoin price is pivotal at $9,100 even as selling pressure mounts.
- BTC/USD consolidation to last longer than expected; a bearish inclination puts $9,000 support in grave danger.
Bitcoin price has entered into yet another day of consolidation. The largest cryptoasset has remained pivotal at $9,100 after failing to break the initial resistance at $9,200. On the flip side, bulls have perfected their act of defense especially at $9,000.
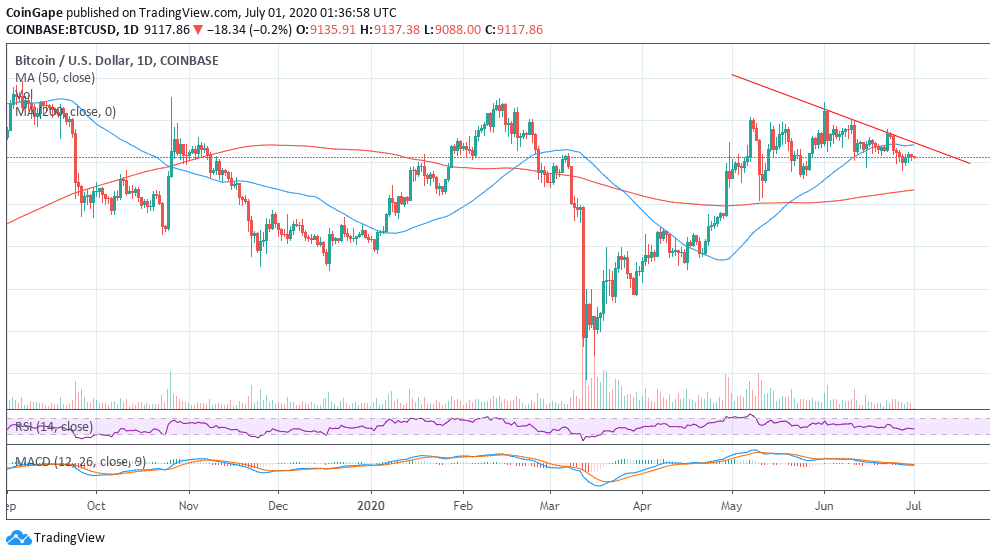
Apart from the seller congestion at $9,200, buyers are also intimidated by the resistances at $9,300, the 50-day Simple Moving Average (SMA) at $9,424.43, and a key descending trendline. It is apparent that a break above the trendline would ignite another rally towards the coveted $10,000.
Meanwhile, Bitcoin bulls are left with the only option of settling for consolidation around $9,100. The Relative Strength Index (RSI) clearly confirms the sideways trading with its leveling motion at 45. As long as this indicator stays in the same position, BTC/USD would last longer in consolidation. Moreover, the RSI’s movement; either up or down would be a great indicator for the direction Bitcoin is likely to take at end of the choppy market.
BTC/USD daily chart
 BTC/USD price chart by Tradingview
According to the Moving Average Convergence Divergence (MACD), Bitcoin is likely to last longer in the current state. However, the slightly bearish divergence from the MACD insists that sellers have the upper hand, at least for now. In other words, Bitcoin is not in the clear and could eventually drop under $9,000 particularly if more sellers join the market.
Other support areas apart from $9,100 are $9,000, the previous support at $8,900, and $8,600. If push comes to shove the 200-day SMA at $8,357.34 will come in handy to halt possible losses towards $8,000. For now, the domineering trend is sideways biased.
Bitcoin Intraday Key Levels:
Spot rate: $9,115
Relative change: -20
Percentage change: -0.23%
Trend: Bearish biased
Volatility: Shrinking
Follow CoinGape to stay updated with the latest price movements!