
- Bitcoin price struggles to contain losses above $9,200 after another weekend rejection at $9,400.
- BTC/USD is likely to embrace consolidation above $9,200 before a breakout above the trendline resistance comes into the picture.
The granddaddy of cryptocurrencies, Bitcoin has in the past few days struggled to stay afloat. Last week the king of digital assets dived from $10,000 and tested $9,000. However, a shallow recovery ensued with bulls rolling the price upwards towards $9,500. Unfortunately, the market has remained relatively stable but characterized by minimal trading volume; a situation that continues to limit the bulls’ efforts.
At the time of writing, BTC/USD is in the middle of a retreat, targeting $9,000. The price is dancing with $9,265 (on Coinbase). It is also trading below the moving averages whereby the 50 SMA is likely to hinder growth at $9,407 and the 100 SMA currently holds the position at $9,466.
Looking at Bitcoin’s 1-hour chart from a technical perspective, we can tell that the crypto is in the hands of the bears. The Relative Strength Index is on a downward slope. A slide under the midline (50) would further call more sellers into the market. However, consolidation is also likely to take place at $9,200, thereby shifting the focus back to $10,000. Moreover, the Relative Strength Index (RSI) is stuck below the mean line. A bearish divergence from the MACD suggests that declines are bound to continue.
BTC/USD 1-hour chart
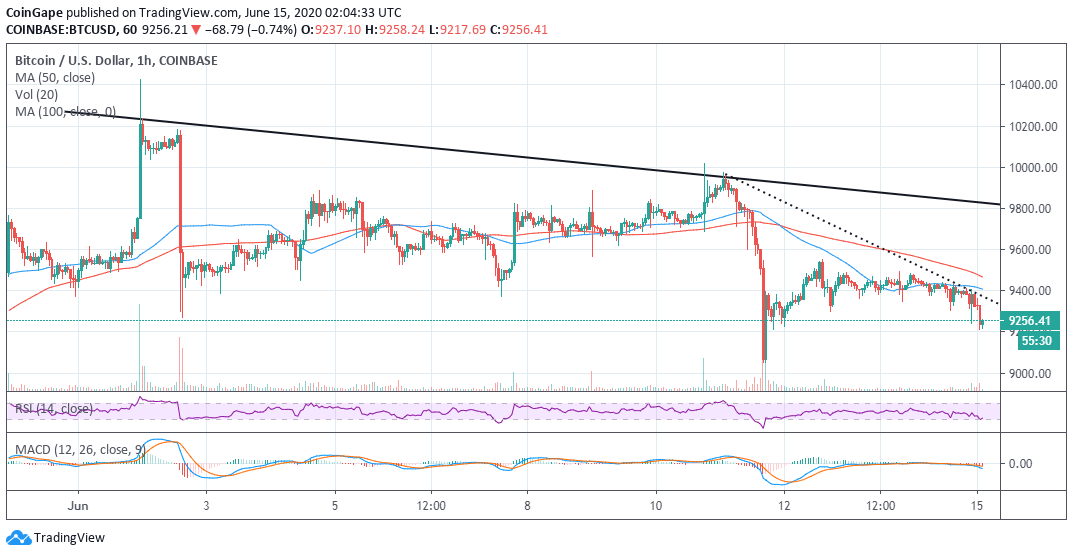 BTC/USD price chart by Tradingview
For now, it is essential the bulls keep the price above $9,200 or risk retesting $9,000. Note that last week BTC/USD traded closer to $9,000. Therefore, trading action below $9,000 is not in the picture. After all, in May, Bitcoin slipped into the $8,000 range. At some point, testing the support at $8,000.
Bitcoin Key Levels:
Spot rate: $9,255
Relative change: -66
Percentage change: -0.77%
Trend: Bearish
Volatility: Expanding
High: $9,358
Low: $9,211
Follow CoinGape to stay updated with the latest price movements!






