
Hello everyone, today I intend to share with you my study of the latest events in bitcoin and how it influences the crypto market in general. The recent price pump brings us several opportunities, especially with altcoins that tend to have a lot of volatility in these periods, cryptocurrencies like Litecoin (LTC) tend to follow the flow of our beloved bitcoin, already cryptocurrencies like Cardano (ADA) have the cycle reverse. I intend to talk about this later in the study, for now we pay attention to bitcoin.
I would like to remind you that this is a study, I intend to show points that can cause the price to go up and points that can cause the price to go down, although it does show part of the mentality that I will use in managing my portfolio this month, no I am recommending buying or selling any of the assets that I will quote here.
Bitcoin monthly chart and institutions
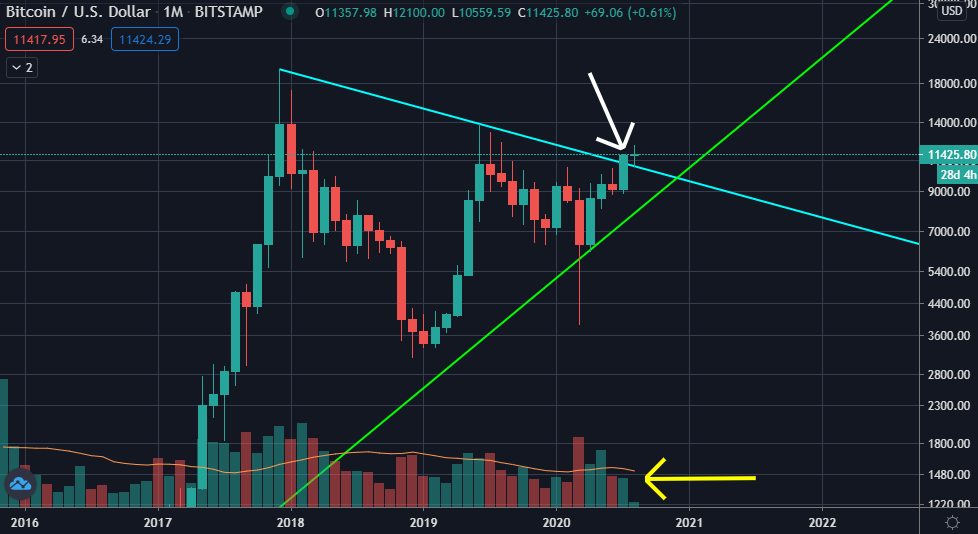
Starting on the monthly chart, I would like you to pay attention to the candle with the blank arrow that refers to the month July, it broke the downtrend line that comes from the historical top of bitcoin, in a large number of portals where it is discussed about bitcoin I noticed a positive feeling and the old feeling that the price will continue to rise "until the moon", interestingly when analyzing the volume at the moment of the break (yellow arrow) it is noticed that it was lower than the previous two months.
We have to be careful with these herd sentiments, in the last bull market we only had subsequent bullish candlesticks after the breakdown of the historic top, we now see events never before found on bitcoin charts like the sharp drop after the golden cross, we are in a great moment of decision where the cycles point to an increase in the medium term but that does not mean making larger contributions to the trades or risking a higher percentage of the portfolio.
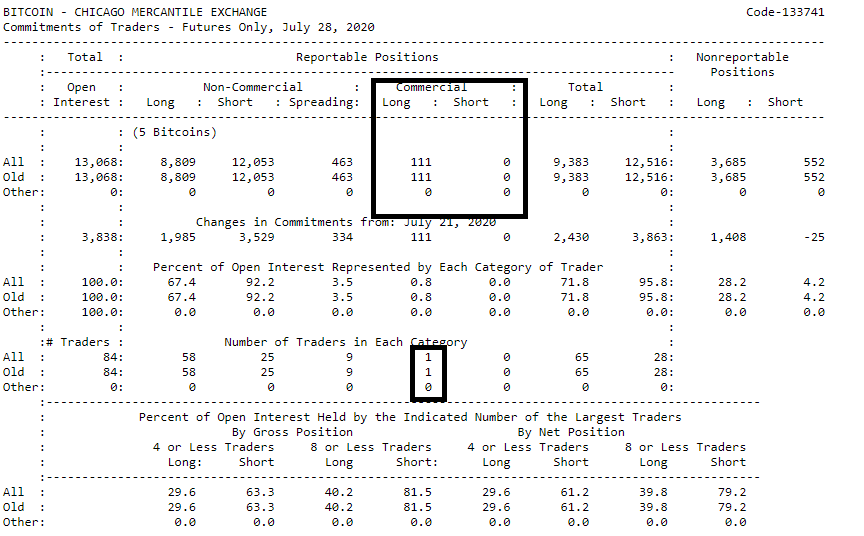
Looking at the CME report for the week 21-28 July, we see that a single financial institution was positioned with 111 bitcoin contracts (555 bitcoins), this huge purchase of a whale may have been responsible for the low volume pump that we had, giving us room to believe that this month could be lateralization before the decision. In my last shared studies I showed that an institution had entered (at the time with few contracts) after a year without positioning itself in bitcoin, I confess that I didn't have so much time to monitor these positions, but now that we are seeing larger entries it is necessary to be careful in the analysis and before positioning ourselves (mainly in swing trade) be aware of the indicators that show us how the whales are positioned, indicators such as CME reports, Tensor Charts, Crypto Fear and Greed and the Long Short Ratio, if you do not know these indicators I recommend that you master them to improve the management of your portfolio and not fall into traps.
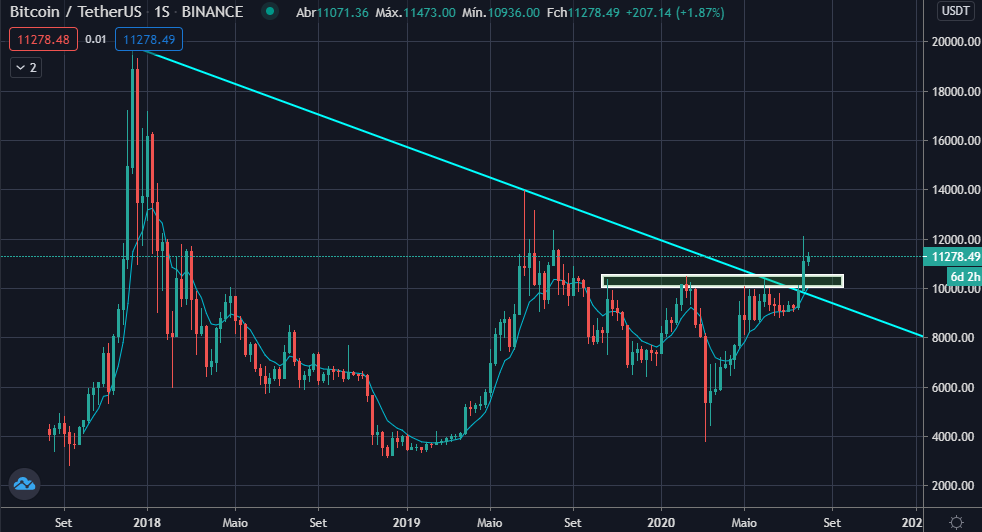
On the weekly chart we have positively broken the downtrend line and differently from the monthly chart we have broken quite a lot with most of the positive indicators at the moment, it is important to note that the $ 12,000 region is as strong a resistance as the $ 10,300 support is then it is natural for bitcoin to lateralize for a few days or weeks in this region before making a decision on which side it should go, observing that institution's position in the CME will be fundamental in these next days, if the $ 12,000 break through the next resistance seen in the chart is at $ 17,000. If you missed this pump that we had in the price, that great resistance region that we had at $ 10,300 may be the ideal point to enter the market now if you have lost it as it has now become a support and it is natural for bitcoin to try get back to that point for a test before continuing your long climb journey.
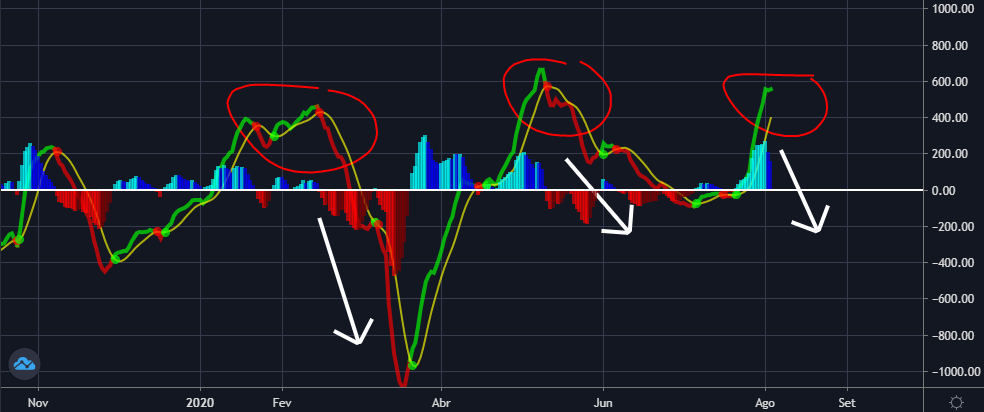
In the short term an important point to keep an eye on is the MACD indicator, which is at a very important point, whenever it reaches these price levels the trend is clearly falling, it is not possible to say that this will immediately lead us to test that support I mentioned above because the stochastics have just finalized the possibility of selling, but it is an important indicator to keep an eye on in the coming days.
Market capitalization, Bitcoin dominance and mini alt-season
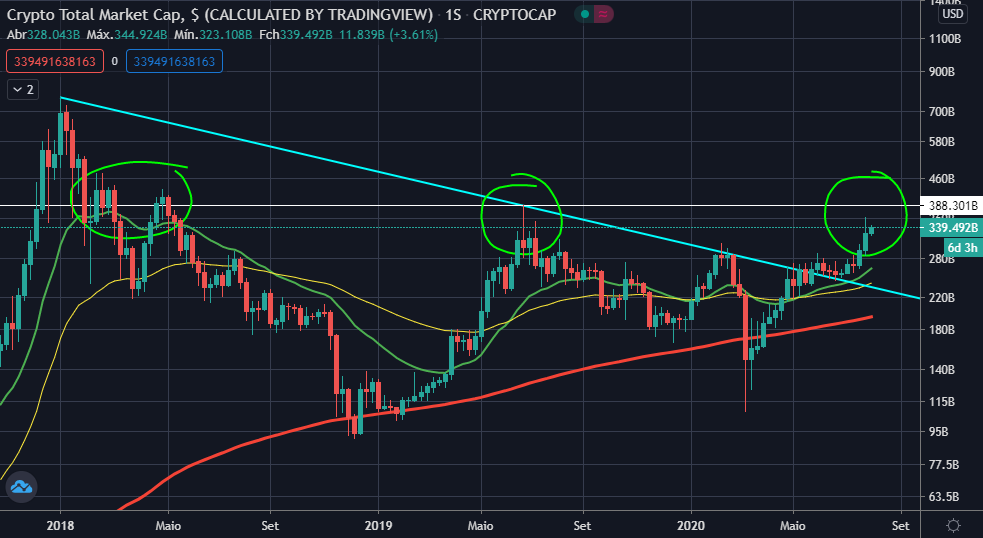
Looking at the weekly chart of market capitalization, we noticed an extremely positive bias, we had a break from the downtrend line of the historic top and we are on the way to an important resistance at 388 billion dollars, the moving averages are signaling an upward bias . The healthiest for the chart would be a rejection at 388 billion and a break in the next test. This movement of capital entry into the market is great because it conflicts with the bitcoin dominance graph that has been showing constant declines that characterize a capital migration to altcoins.
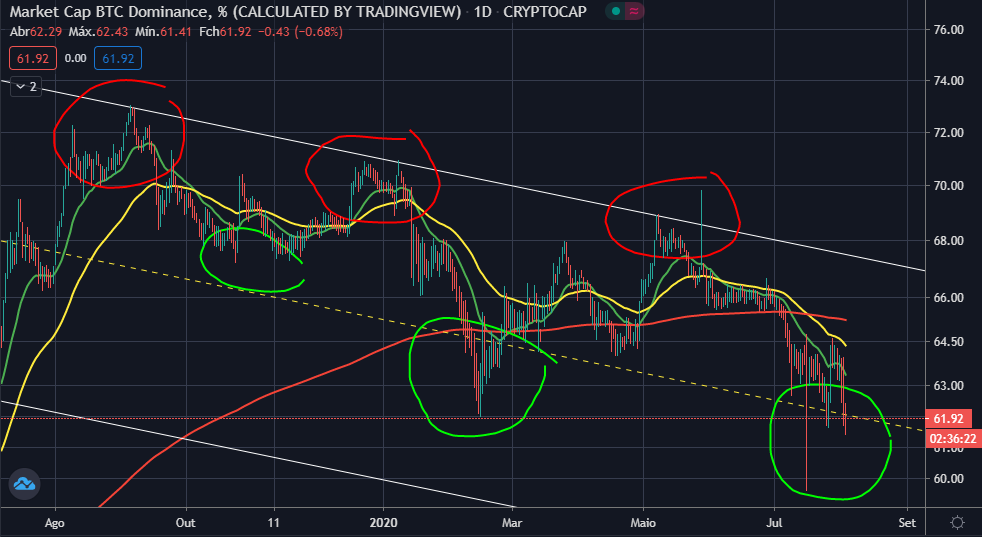
As we see above, dominance is clearly on a downward trend. Usually when this happens we have an appreciation of altcoins against bitcoin, it is also important to note that this downward trend is observed in the daily and weekly charts, so we cannot talk about a real alt season yet, we could only talk about it when (and if) dominance falls below the very strong support we have in each 52/50. What we must do now is to observe the individual behavior of each cryptocurrency we wish to trade and see how it reacts to changes in bitcoin and its dominance so that we can decide how to position ourselves in each of them. With this volatility of bitcoin the most recommended is to take advantage of these trading opportunities in pairs of stablecoins (such as USDT, BUSD and DAI) as any sudden change in bitcoin can affect the analyzes we do in totally unpredictable ways.
In order not to take chances with BTC peers, I am making trades with a small percentage of my capital trading futures contracts leveraged in binance with a very simple setup that I shared some time ago (If you do not have a futures account at binance you can create one with my referral code by clicking here or typing Zulonga at the time of creation to get discounted rates).
Pairs with great opportunities
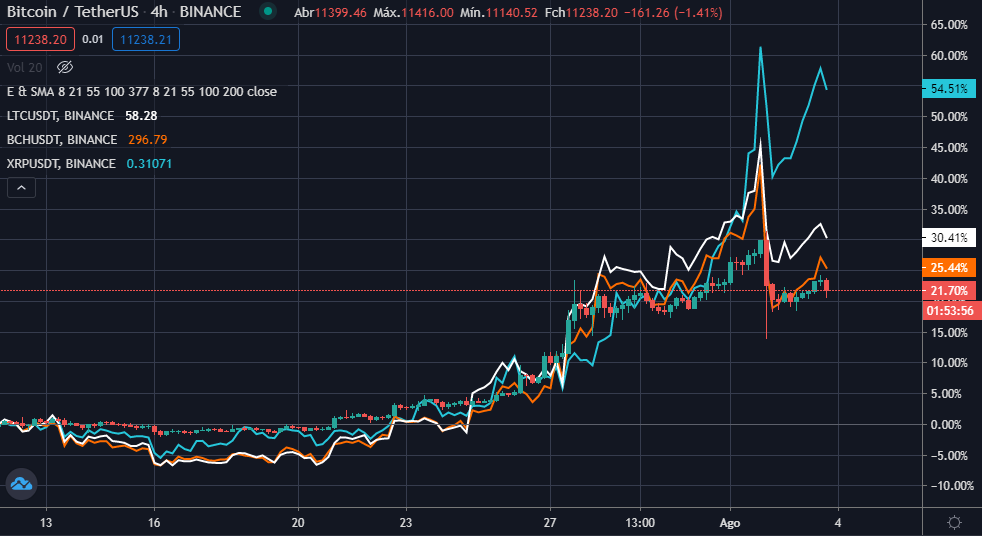
The three cryptocurrencies that overlap with bitcoin (LTC, BCH, XRP) are the perfect example of cryptocurrencies that follow the rotating cycle of bitcoin, when bitcoin is sideways, they are also, when bitcoin goes up, they also go up, when bitcoin falls, they also fall. The opportunity you have there is exactly in the response time and the volatility that tends to be higher in altcoins, for example we have the most recent recovery, we saw there that bitcoin fell and they all fell together, when bitcoin showed a sign of that the fall stopped they went back to subit (highlight to the XRP that performed better). With the right strategy and good management they can become great sources of profit.
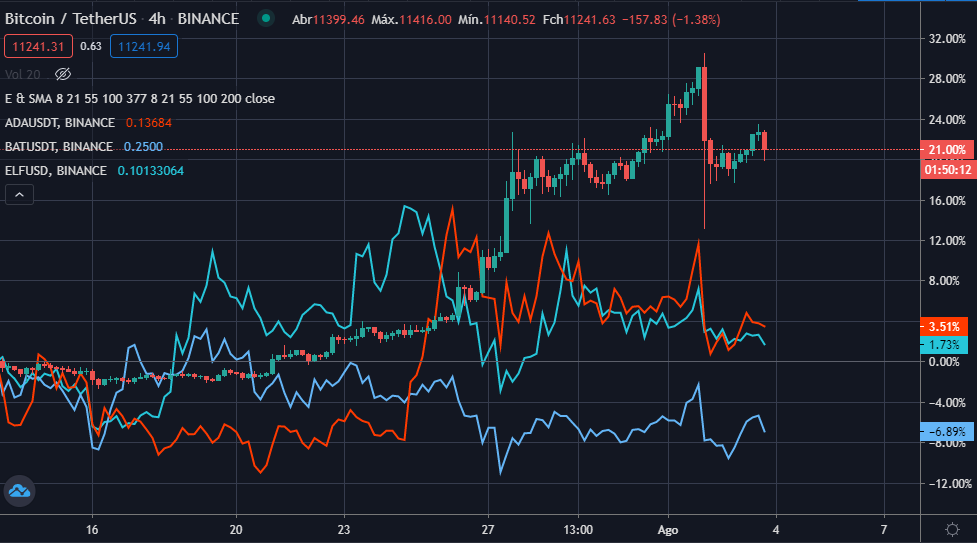
Examples of contrary rotation are ADA, BAT and ELF. While bitcoin performs absurdly, these altcoins revolve around their own axis, even if they have a high volatility in the end they ended up being close to the initial value, which can be a great place for conservative traders to keep an eye on during this troubled period.
Thank you for reading :D


