In the dynamic world of crypto trading, understanding the fundamental concepts of volume, volatility, and momentum is crucial for making informed decisions. These factors play a significant role in shaping market trends and can greatly influence your trading strategy.
Volume
Volume represents the amount of cryptocurrency traded within a specific timeframe (e.g., 1-, 2-, 4-, 12-hour timeframes). High volume indicates strong interest and liquidity, while low volume can signal weakness or potential for price manipulation. High volume confirms a price move. If the price breaks through a resistance level on high volume, it suggests strong buying pressure. Conversely, a breakdown of support on high volume indicates significant selling pressure. Look for volume spikes which can signal upcoming price movements. For instance, if Solana's price breaks above a resistance level, with significantly higher volume than usual, it might be a good time to buy.
Smart money traders often use volume analysis to detect institutional activity. Large volume spikes with relatively small price movements might indicate institutional accumulation or distribution. These volume anomalies can provide early warning signs of potential trend changes, as institutional positioning often precedes major market moves. Several specific volume patterns deserve special attention. The three-bar volume pattern examines relationships between consecutive volume bars. Rising volume over three bars often signals increasing market interest and potential trend continuation. Declining volume over three bars might indicate waning interest and possible trend exhaustion. Traders use these patterns in conjunction with price action to time entries and exits.
Volume analysis plays a crucial role in spotting divergences that may signal potential trend reversals in the market. One of the most telling divergence patterns occurs when price continues to rise but is accompanied by steadily decreasing volume, which often indicates that the uptrend is losing momentum and buyer conviction is waning. This scenario suggests that despite higher prices, fewer participants are engaging in the trend, potentially foreshadowing a reversal. Similarly, when price is falling but volume is simultaneously decreasing, it can suggest that the downtrend is losing steam and seller conviction is diminishing. This weakening selling pressure, evidenced by lower volume, may indicate that the downtrend is approaching exhaustion and a potential reversal could be forthcoming. Traders often use these volume-price divergences as early warning signs to adjust their positions or prepare for possible trend changes.
Volatility
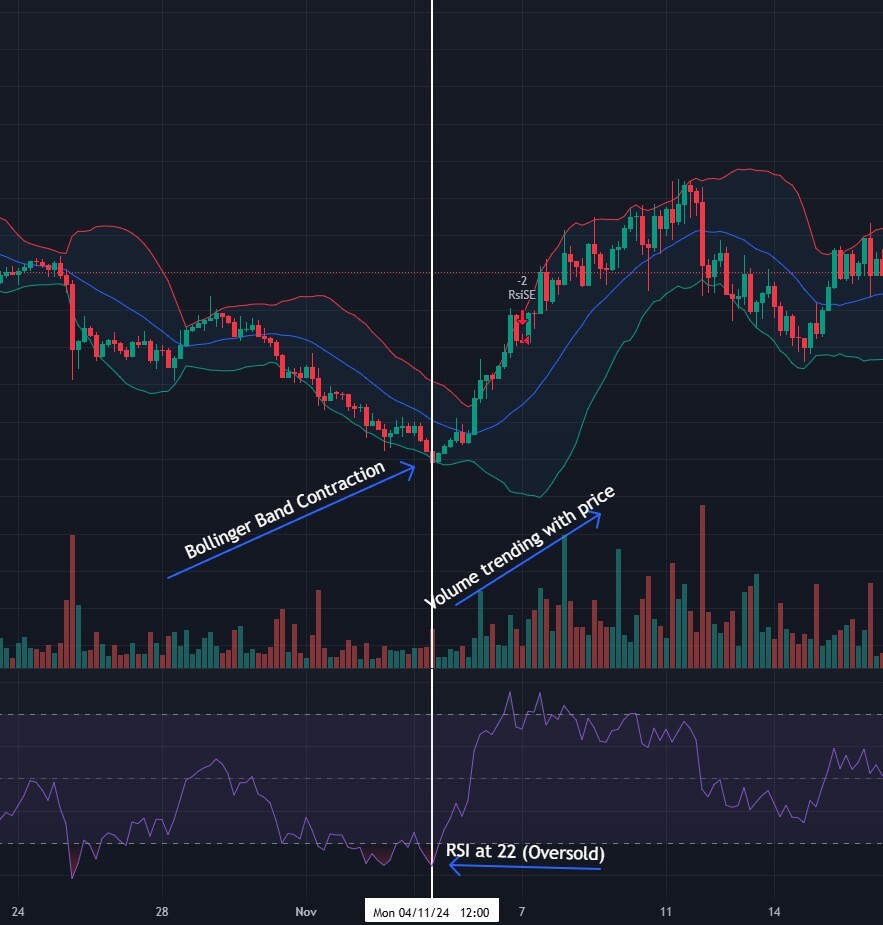
Volatility refers to the rate at which the price of an asset increases or decreases over a certain period. High volatility is indicated by larger and more frequent price movements, while low volatility is characterized by smaller and less frequent price changes. Volatility often comes with increased trading volume. Markets with high volatility can be more exciting, and potentially, more profitable, as they provide more opportunities for price movements. However, they also come with more risk. The Bollinger Bands technical indicator envelopes around the moving average that widen and narrow based on volatility. Traders often look for several key signals when using Bollinger Bands. One of the most significant is the Bollinger Squeeze, which occurs when volatility decreases and the bands contract. This compression often precedes significant price movements, much like the calm before a storm. When traders identify a squeeze, they prepare for potential breakout opportunities, in either direction, typically confirming their analysis with volume and additional technical indicators, like the RSI, to validate the eventual breakout direction.
Momentum
Momentum refers to the direction and strength of a price trend. It gauges whether the price is likely to continue moving in its current direction. Momentum helps traders identify and ride trending markets. By identifying the direction and strength of a trend, traders can position themselves for potential profits. Moving averages stand as one of the most versatile and widely-used technical analysis tools in trading. The two primary types of moving averages, Simple Moving Average (SMA) and Exponential Moving Average (EMA). EMAs are particularly useful for shorter-term trading, while SMAs often excel in identifying longer-term trends. Moving averages help identify trends through their slope and position relative to price. An upward-sloping moving average suggests an uptrend, while a downward slope indicates a downtrend. Relative Strength Index (RSI) is a momentum oscillator that measures the speed and change of price movements on a scale of 0 to 100. Anything above 70 indicates an overbought market (price may soon reverse downward).Anything below 30 indicates an oversold market(price may soon reverse upward). Combine RSI with volume analysis to confirm trends. For instance, an overbought RSI with high volume may signal a strong trend continuation.
Analysis In Action
Volume: Imagine Bitcoin is trading at $128,000, and you notice a resistance level at $130,000. Suddenly, the price breaks above $130,000, and volume surges 3x the average. The high volume confirms that the breakout is genuine, not a false move. Thus the trader would enter a long position with a stop-loss just below $130,000.
Momentum: You see Solana's price rising rapidly, and the RSI hits 80 (overbought). Volume is also decreasing. The overbought RSI and declining momentum suggest a potential reversal. Exit your position to lock in profits or consider a short trade, if you’re experienced.
Volatility: Consider a Bitcoin trading opportunity where price has been consolidating in a narrow range for several weeks. Technical analysis reveals tight Bollinger Bands indicating low volatility, with price near the lower band, while the RSI reading below 30 confirms oversold conditions. A prudent trading strategy would involve waiting for bullish confirmation through either a breakout above the upper Bollinger Band or an RSI move above 50 before entering a long position. Risk management would include placing a stop-loss below the recent swing low, while profit management could utilize either a trailing stop or technical-based price target. In a bullish outcome, a break above the Bollinger Bands coupled with rising RSI would confirm entry, allowing for stop-loss adjustments to protect profits as price advances. Conversely, if consolidation continues or price breaks below the lower band, the stop-loss would trigger to minimize potential losses.
By integrating volume analysis with momentum and volatility, traders can develop more robust trading strategies that account for market participation and conviction, potentially leading to more accurate trend identification and trade timing.