Lets look at BTC / USD Daily Chart 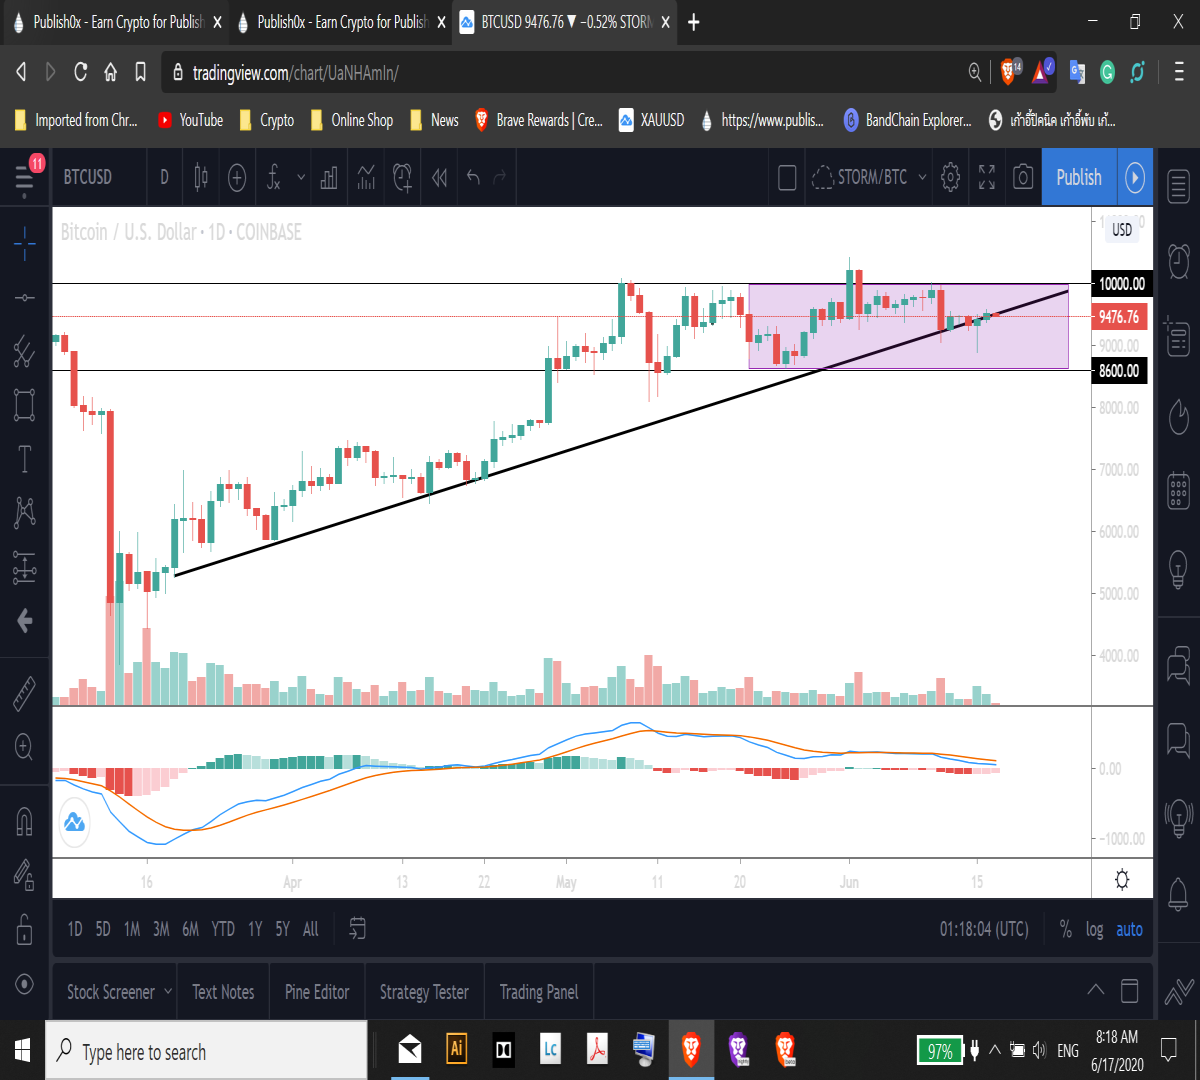
As you see from the chart BTC is following ascendig trend line and we see that this line becomes a resistance for BTC for a while . Resistance according to tree line stays at $9600 and trying to push towards $10000 is always possible . down side $8600 to $8400 looks like as a support area. This time is BTC just moving sideways and trading upper and lower ends of trading channel and no indication either move up or down , Just wait ad think about our trading position well and watch for the signs .
Install BRAVE Browser and earn BAT tokens for surfing
https://brave.com/bab738

BITCOIN (BTC) Short Term Price Prediction
By skyislimit | CryptoCoin Predictions Series Short Term | 17 Jun 2020
Resources
How do you rate this article?
4

skyislimit
Dentist since 1985, Oracle Developer DBA since 1998 and trader 2000 and up today. I try to give my best future price predictions on certain coins and I do trade same way.

CryptoCoin Predictions Series Short Term
I will give you my ideas about certain coins and my trading strategy about the future I just want you know that i am not a financial adviser and any information i give in here is my personnel opinion . If you follow me regularly i will post updates and future predictions about coins i hold and trade . My price predictions are short and not detail ( since i do not to bore anybody with long readings )
Send a $0.01 microtip in crypto to the author, and earn yourself as you read!
% to author / 80% to me.We pay the tips from our rewards pool.


20 hours ago
1 minute read


16 Jul 2026
2 minute read


13 hours ago
1 minute read
