Bitcoin price technical analysis:
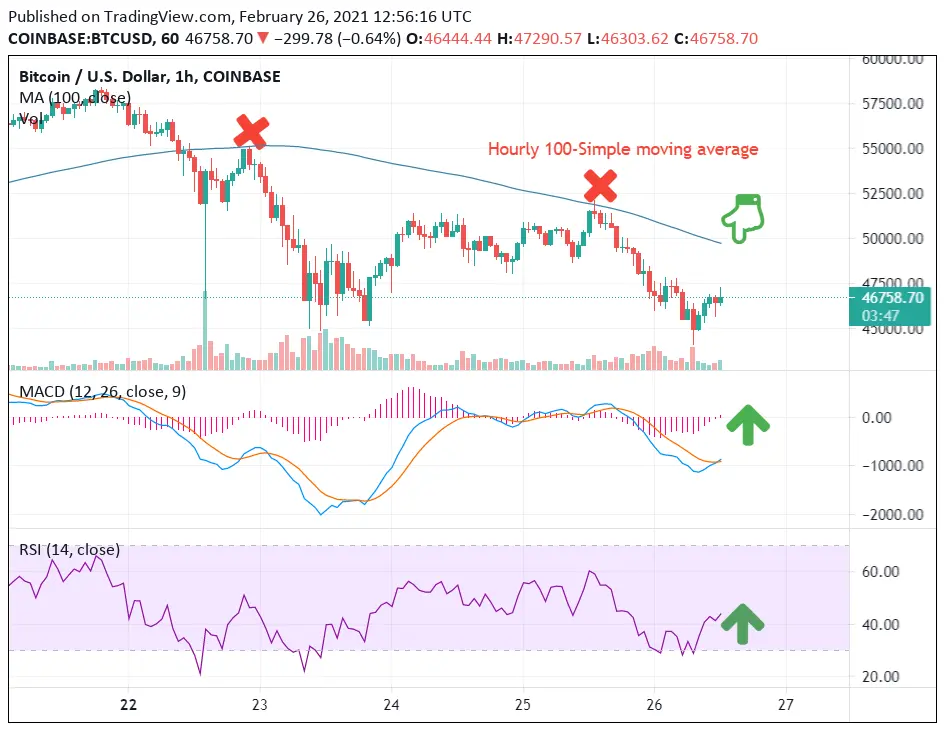
Yesterday, after clearing the key resistance level at $51,650, Bitcoin price recovered further to $52,000, however it failed to maintain the momentum above the hourly 100 Simple moving average. In the following sessions, the Bitcoin price dropped sharply to retest the key resistance zone at around $45,000.
Currently BTC trading at $46,750 per coin, the key resistance is now at $49,500. This new resistance zone is close to the hourly 100 simple moving average which in the past 2 cycles has acted as strong resistance yet to be overcome by Bitcoin bulls. If there is a successful close above $49,500, Bitcoin price could push further to retest $52,000.
Dips supported?
If Bitcoin fails to gain strength above $49,500, there could be pulled down to $45,000. If the price doesn't hold at this initial support level, it could dive further to the $40,000 mark.
Technical indicators:
-
Based on hourly BTC price change, the MACD is gaining momentum and the RSI of BTC /USD is also gaining strength.
-
Major support for BTC/USD pair is at $45,000, followed by $40,000.
-
Major resistance for BTC/USD pair is at $47,500, $49,500 and $52,000.