
Hello everyone ! In this article we will explore the MACD indicator. A powerful tool that will help you understanding the price movement.
What is the MACD
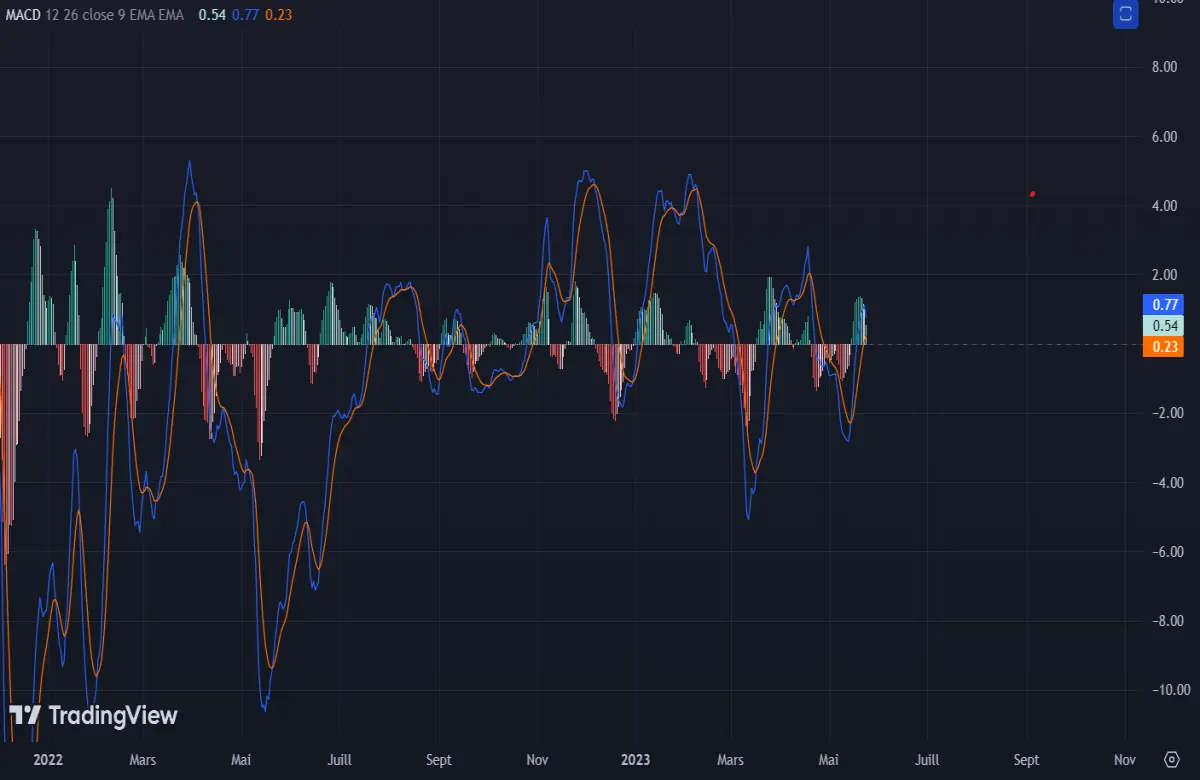
MACD is an acronym for “ Moving Average Convergence Divergence “. It is compose of :
- 2 exponetials moving average ( EMA ) that are set as EMA 12 and EMA 26 the diffirence between those two represent the MCAD line ( bleue line )
- A signal line which is a EMA 9 ( orange line )
- An histogram that represent the gap between the signal line and the MACD line the bigger the gap the higher the histogram is.
- There is a also a “ zero line “ that is very important, we are going to see why.
How to interpret it
So why are there green and red colors on the histogram ? It is because when the MACD line is below the signal line the histogram is red indicating a bearish signal and when the MACD line is above the histogram turn green signaling a bullish signal.
Nevertheless, a Bearish Trend is when the histogram and the signal line are both below the zero line and vice-versa.
Of course this alone cannot always work sometimes there is a falses signals :
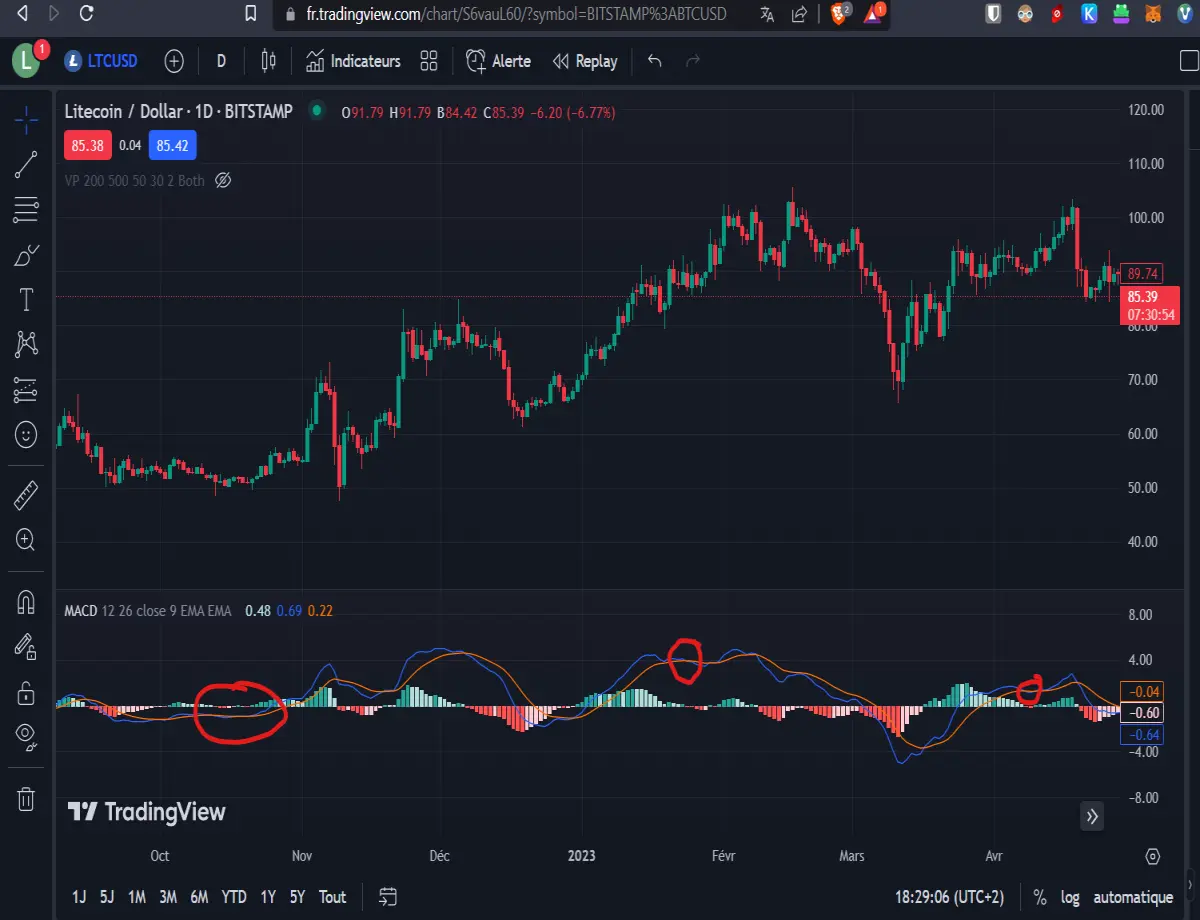
Before i explain how to spot some of the false signal, you need to know that like the RSI the MCAD indicator is a momentum indicator, it work very well in a established trend but poorly when the market move in a range. We need to find the trend ( Put an EMA 200 if the price is above → bullish trend and vice versa ) and then never going against the trend even tho there are some exception like will see :
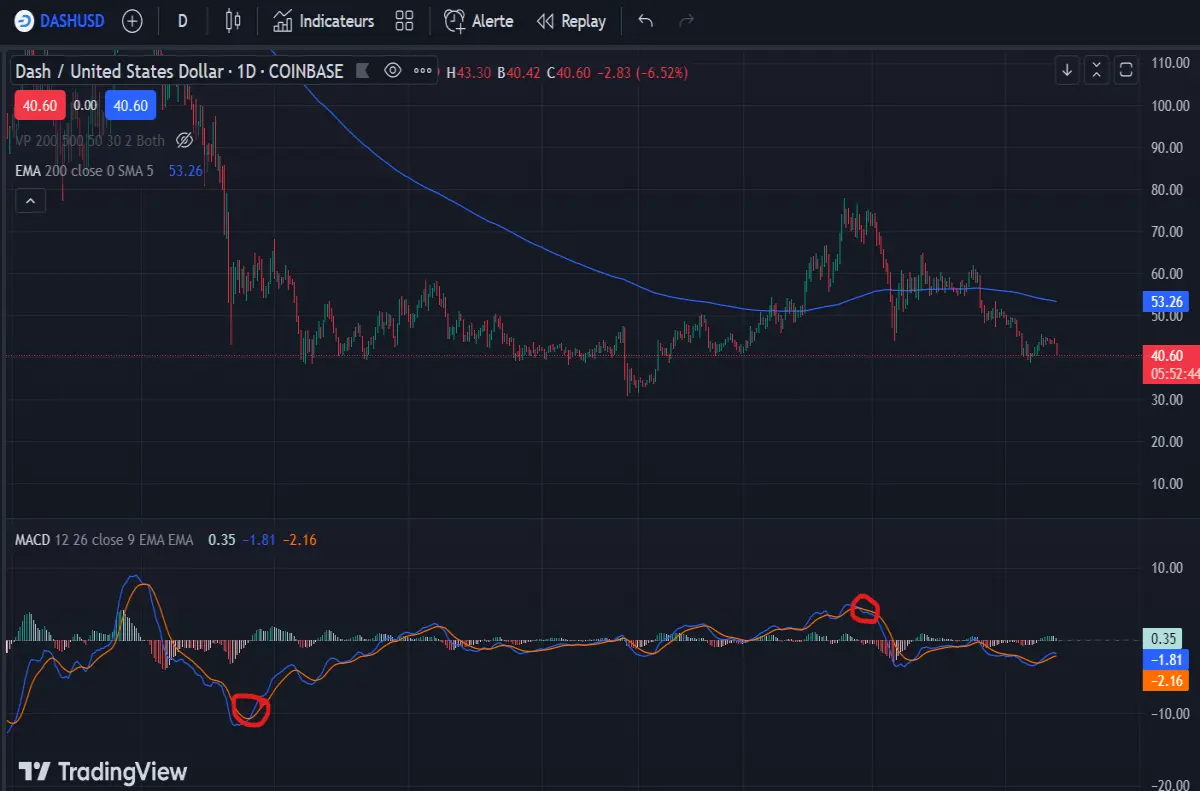
The first circle : False bullish signal, why ? Below the 200 EMA, it’s only a correction in a bearish trend.
Second circle : An exception because it’s a sell signal in a bullish trend so we might think it’s just a minor correction that will happen but here the bears are too strong and the price can’t hold on the EMA 200 anymore.
Conclusion :
MACD is an indicator that is simple to use. It can be use in any time frame but you always need to also combine it with other indicators and external information that might shake the market. Thanks for reading ! if you have any questions leave them below, see you next time
Thank you for reading !






