
Where are the main supports and resistances for the popular cryptocurrency located. What the signals show for his future course. How the hash rate is displayed and what role the halving has played.
In this method of technical analysis, the importance follows the time frame. In other words, structures are more important when they are time-consuming, while the importance of reducing their time frame is reduced. In general, a level is characterized as resistance or support when acting as an obstacle to the movement of the price in one direction. Resistance is when the market meets the level on the rise while support when it meets it as the price goes down.
Monthly TimeFrame
Starting with the BTC / USD monthly chart, the following levels of importance are observed:
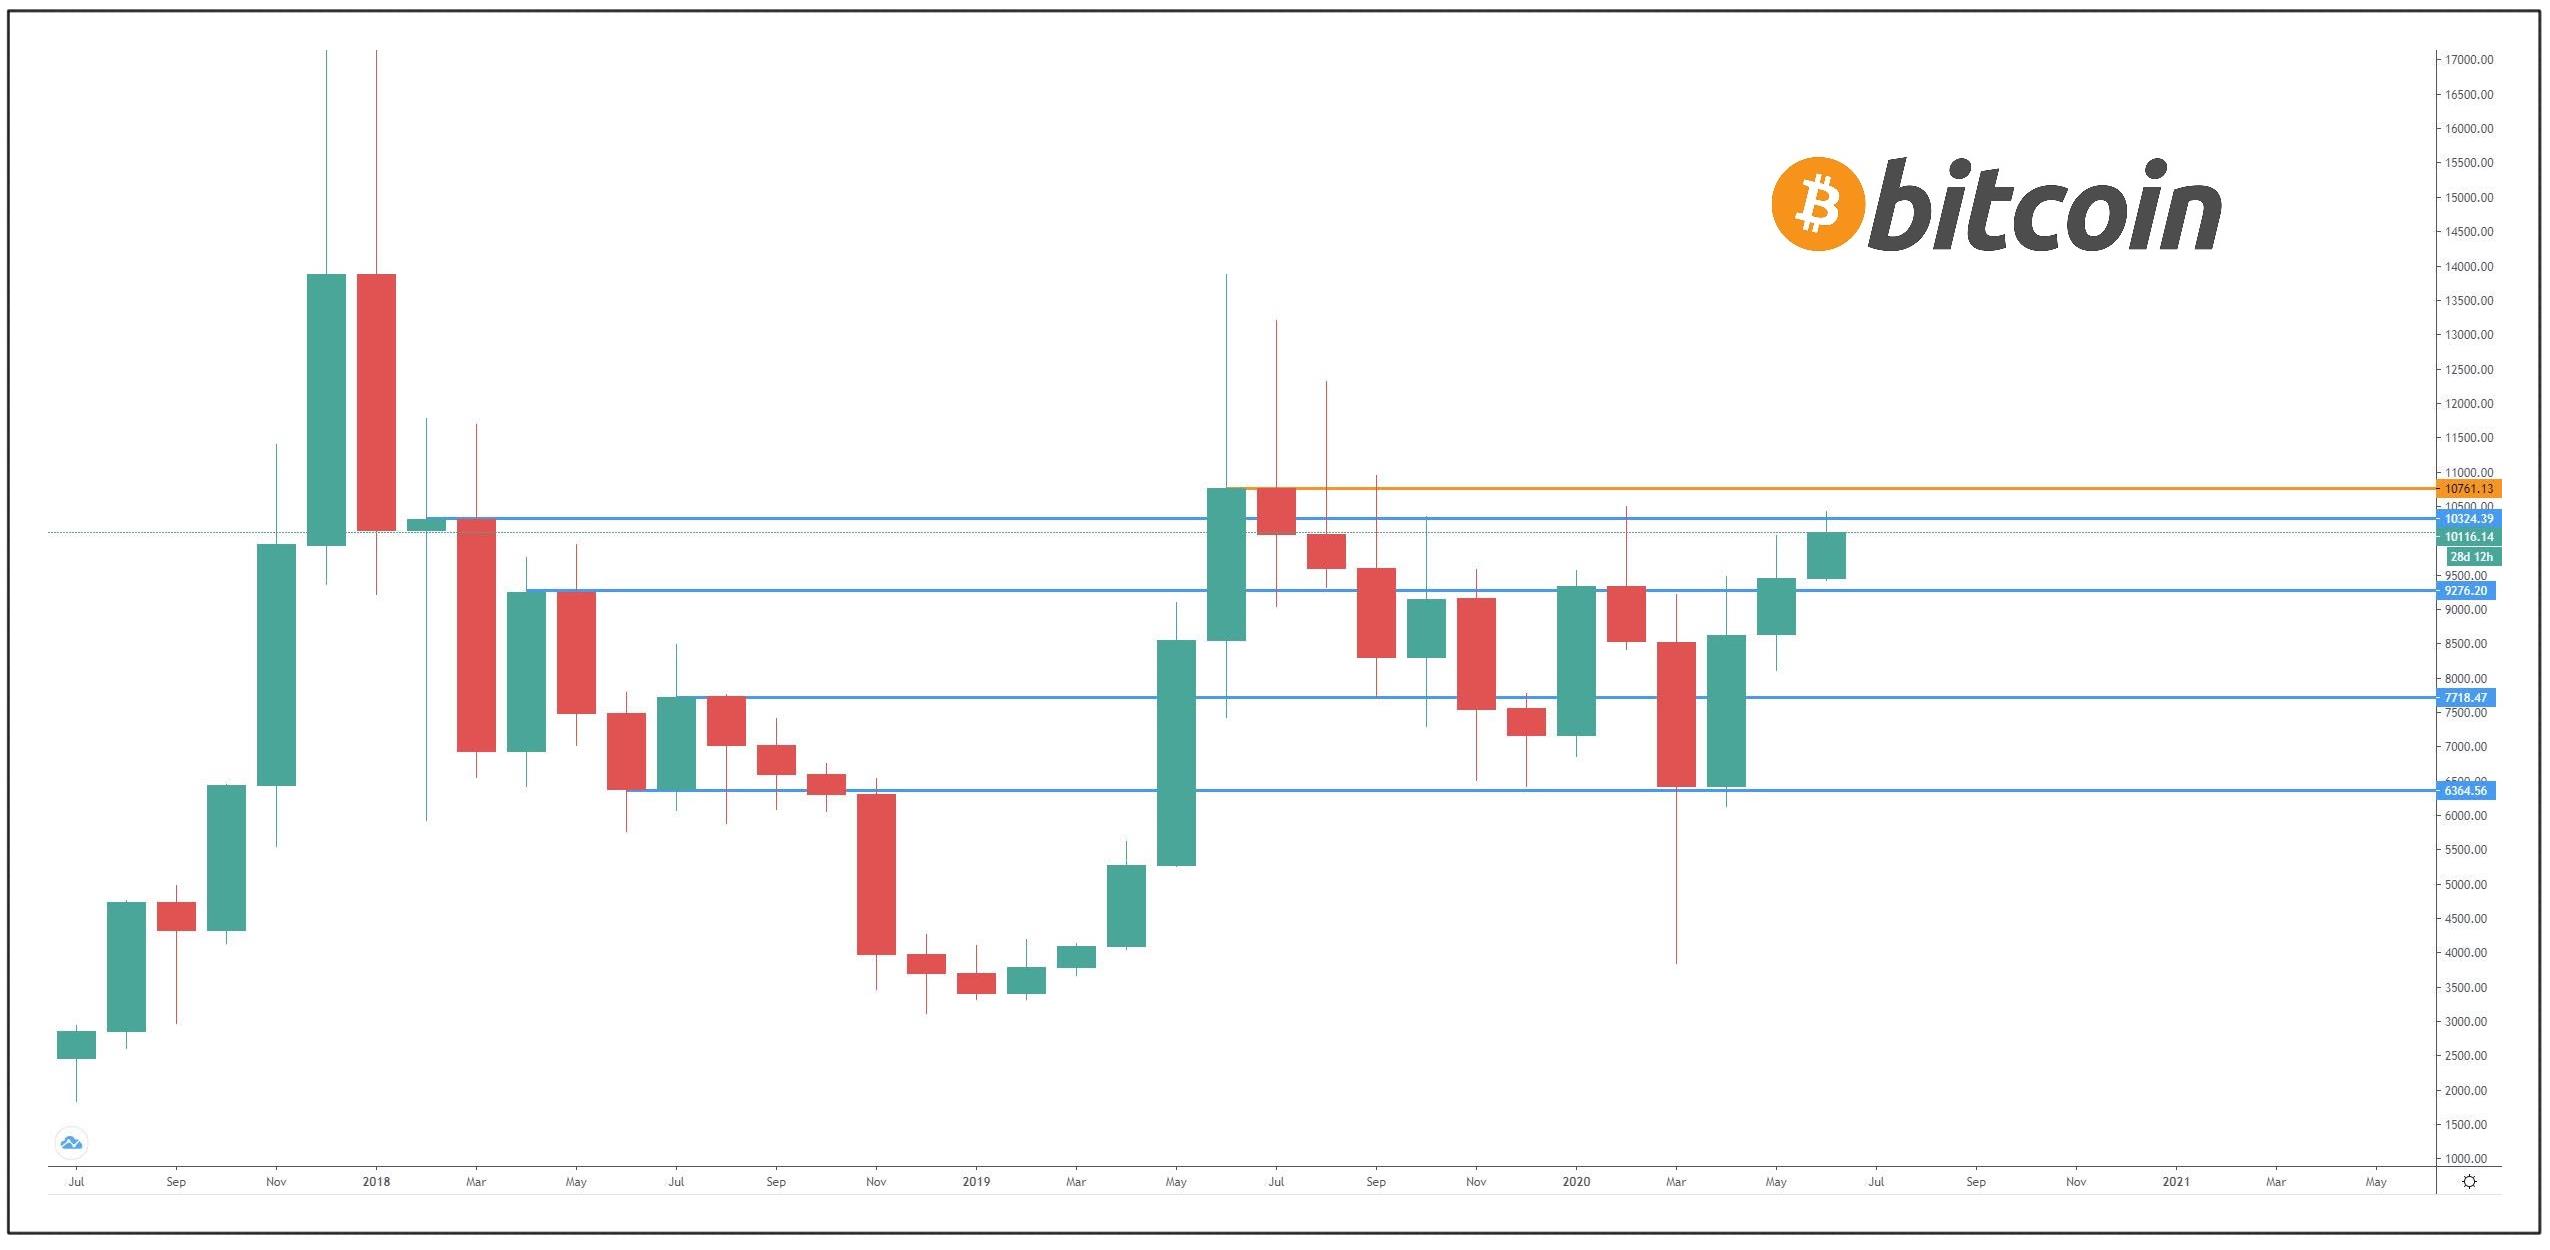
Graph 1: Illustration of the monthly time frame and the relevant significance levels.
Resistance is seen at $ 10,750 and $ 10,320 and support at $ 9,350, $ 7,700, $ 6,300.
The $ 10,750 is the price level that closed the monthly candle after the local high at $ 14,000. At $ 10,320, the level set by the 2018 Bearmarket is set. The level also appears to be a decisive level of resistance in the current correction period.
From October 2019, when the market began to be exchanged below it until the time of writing this article, the market has not given a monthly close above it, which makes it an important level in this time frame. Once it begins to trade above this level, we could assume that this correction has come to an end in terms of the monthly time frame.
Continuing to observe Chart 1, the first level of possible support is found at $ 9,250.The importance of levels is determined by their history. In other words, when a level has no historical significance, it is less important than a level where a systematic price response has been observed. There is a reaction of the price both as a resistance and as a support. It starts as a resistance during the downward market in April, May 2018, then as a support in July, August 2019 and then again resistance in October 2019 until April 2020. It is worth noting that May 2020 closed above this level, a fact which is a positive sign for the monthly framework. We must keep in mind that the closing is marginal (9,446), just $ 200 above the resistance level.
The month of June 2020 has just begun, so it is frightening to include this move in the analysis.
Two other levels of considerable importance as possible support are at about $ 7,700 and $ 6,300. Because the market is exchanged relatively far from the two aforementioned levels, at this stage further reference to them is not necessary. However, they are reported due to the probabilistic nature of the technical analysis.
Weekly TimeFrame
When examining the weekly time frame, it is necessary to reduce the scope of the examination. This is due to the perspective of each context in the present analysis.
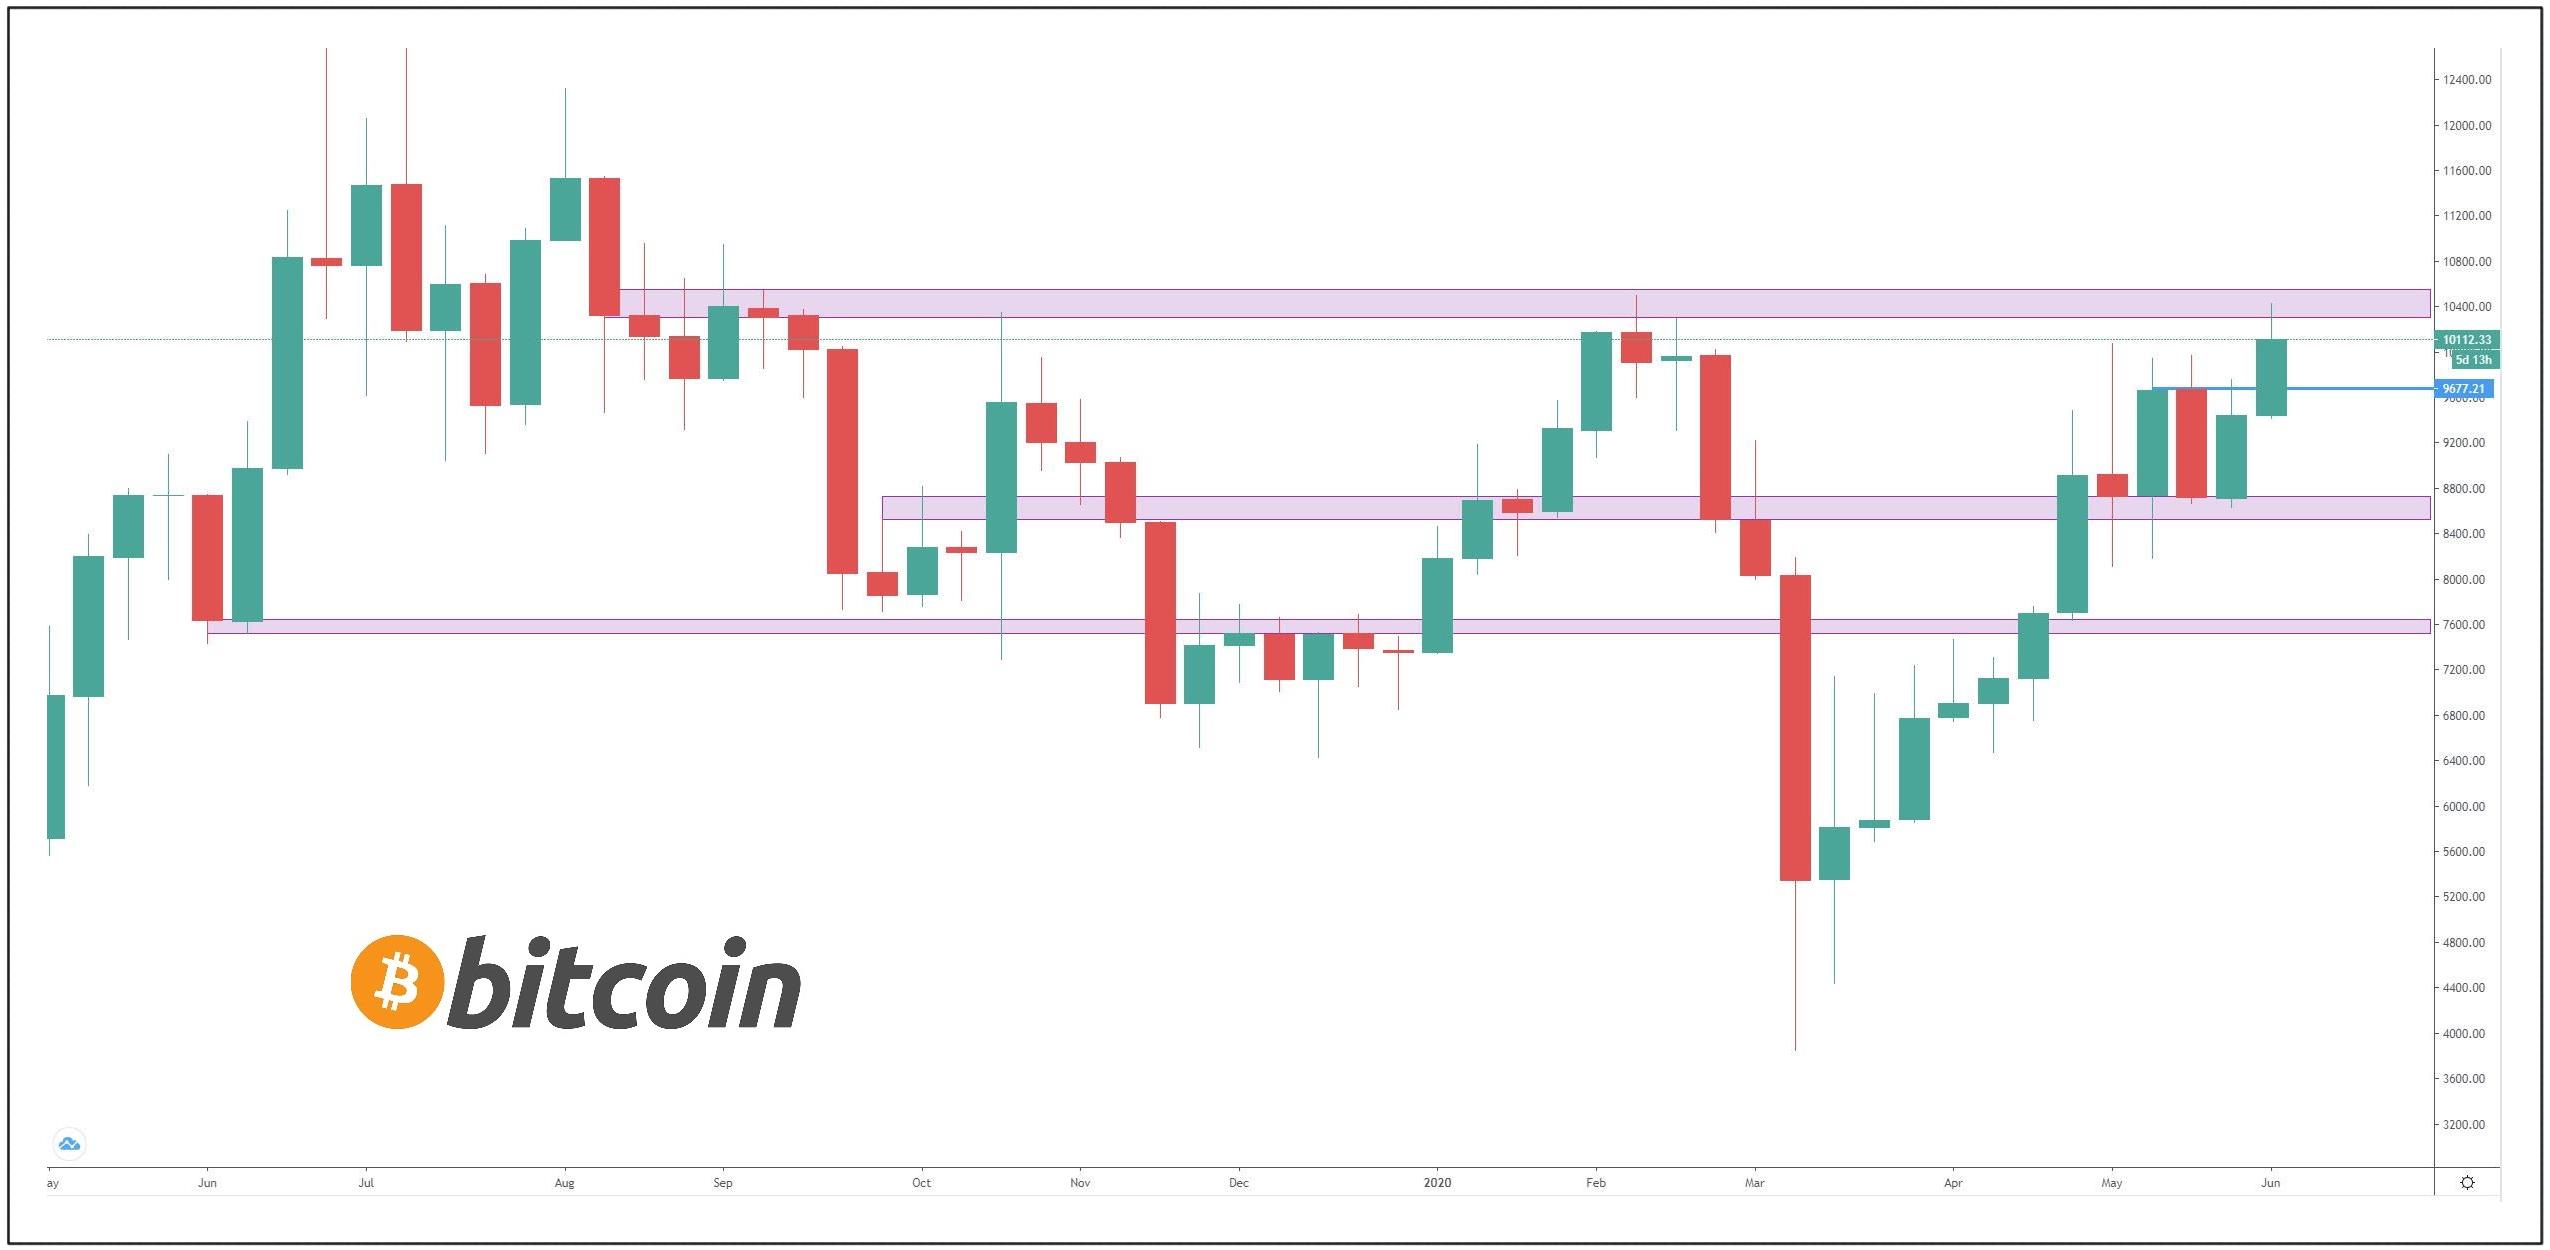
Graph 2: Illustration of the weekly time frame and the relevant significance levels.
In this period of correction, 3 levels are observed, where they are given importance due to their past behavior. From bottom to top, the first support area is at 7,400 - 7,700, followed by the 8,500 - 8,800 area and finally, the potential resistance area at 10,300 - 10,550 dollars. The observation point remains the same as the monthly time frame.
The correction period observed since August 2019, where the overall trend can be considered downward due to net lows, can be estimated to reach its end if at least one or more closures are made above the current resistance zone at 10,300 - $ 10,500.
It should be noted that structurally in this context there is a strong upward trend from the second half of March 2020. This trend can be considered strong, if this week closes over $ 9,660. Without being able to draw an absolute conclusion.
Daily TimeFrame
The analysis of the daily time frame focuses on the upward trend that began in March of this year. Because it is estimated that the time frame of smaller frames is more limited in the present analysis.
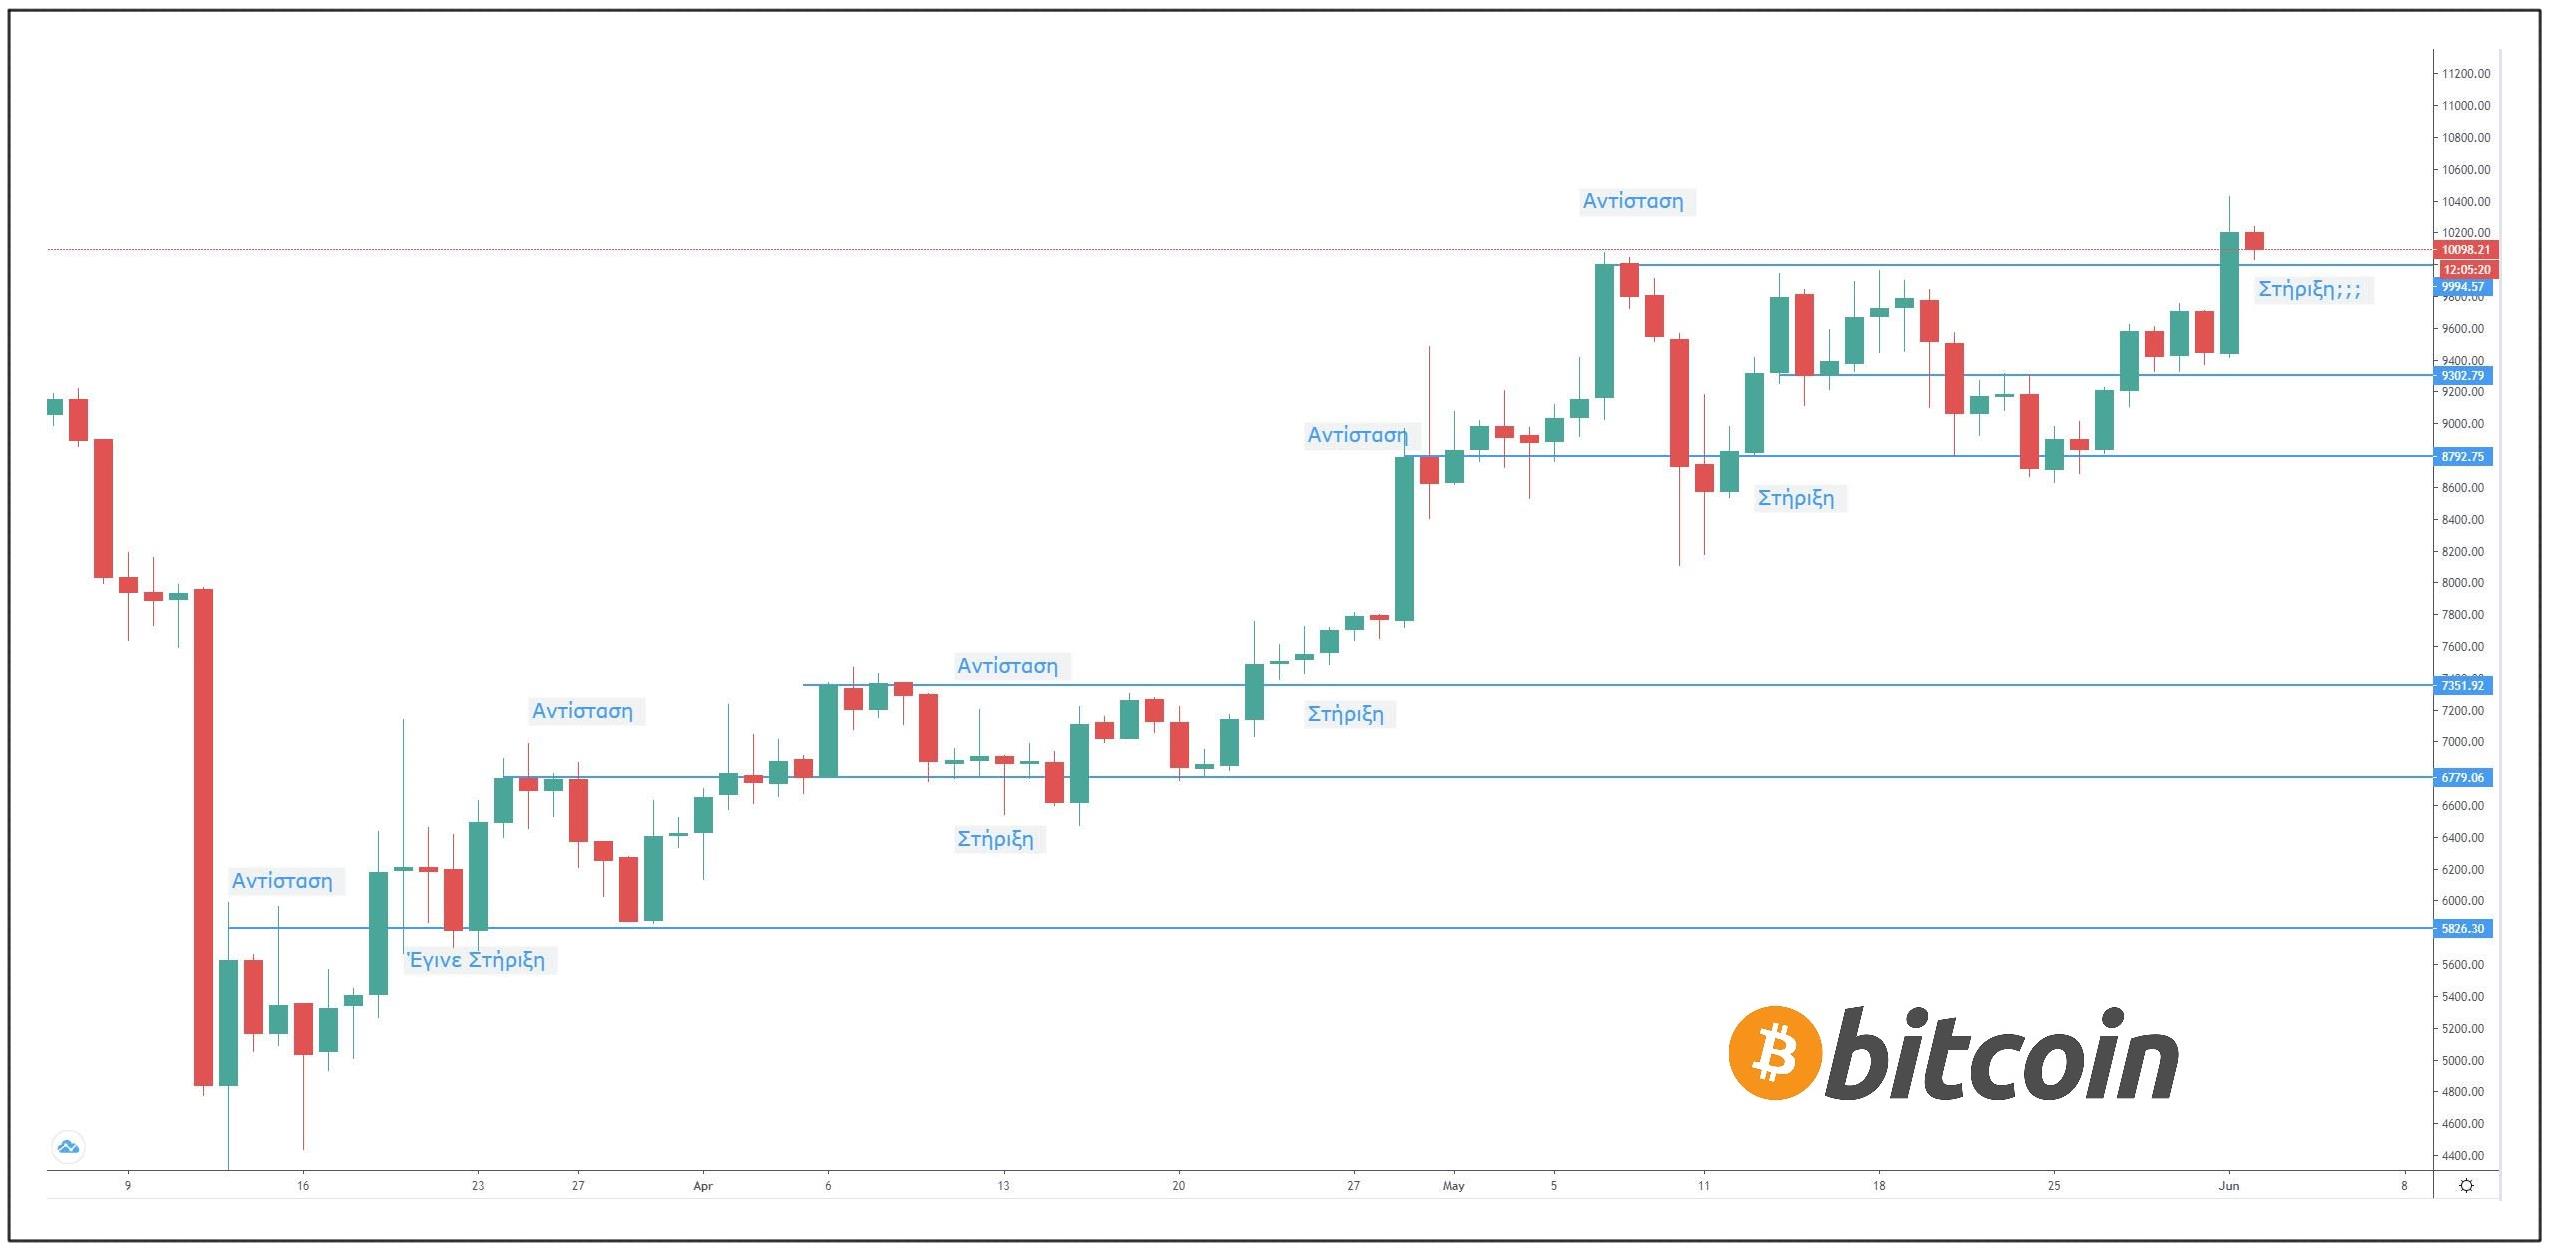
Graph 3: Image of the daily time frame and the relevant significance levels.
During the upward trends, it is historically observed that the local highs tend to function as supports during the next upward movement (swingmove). The same is true of the opposite view in downward trends.
Figure 3 shows this behavior. The upward trend mentioned in the analysis of the weekly time frame is confirmed in more detail.
More important for the view of the upward trend than the maintenance of the previous resistances as supports is considered to be the maintenance of the sequence of the highest local lows and higher local highs.
Bitcoin Hash rate
The following graph shows the bitcoin hash rate. It practically depicts the solutions produced over time in the bitcoin network during the process of securing the network also known as mining.
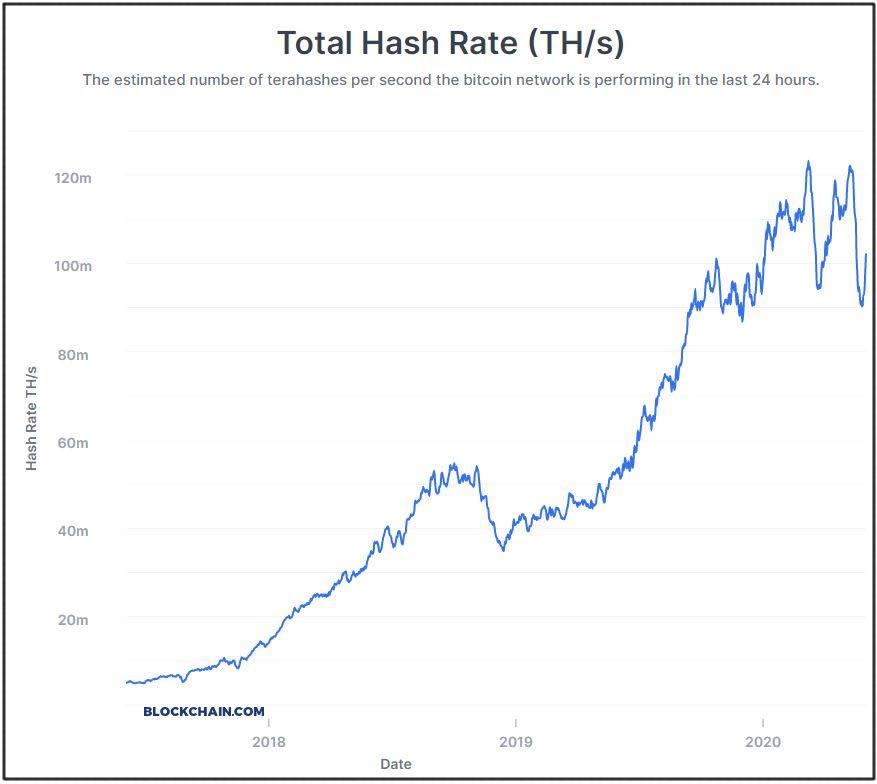
Graph 4: The solutions produced in the Blockchain of bitcoin in Tera Hash are shown. That is trillions of solutions over time.
There is a relatively expected decrease in the production of solutions, which may be attributed to halving. That is the fact of bitcoin deflation. In practice, the rate of production of "currencies" has doubled, as is planned to happen from the creation of the currency.
The above fact can be considered to push many of the producers out of the network. This is due to the reduction in their production, depending on the cost of production. Practically for someone who was profitable to produce coins, with a given cost and a given efficiency, after the deflationary event, it is no longer. Unless he was able to either cut production costs or stock up on more efficient equipment.
Also, production machines known as ASICs, which were marginally profitable before halving, are being pushed out of the network. It may be assumed that their owners are not able to replace them immediately either due to cost or availability or due to delays in obtaining them.
Conclusion
In the technical analysis of the current phase of the market, there is strong resistance in the big timeframes at the level of 10,300-10,500 dollars. The price range that has been re-selected pushes the price to lower levels.
However, since the second half of March 2020, there has been a strong upward trend, with "sympathy" in the daily and weekly timeframe. In the light of the fact that as a level is tested the probability of passing it increases, it is noted that this is the third test that the price makes in this structural resistance.
Of course, there is no guarantee that the price will "break" the level. The positive scenario would dictate the price to pass this structural resistance while the negative would be marked by another failure at this price level.
This article is just my opinion and is by no means an investment tip for bitcoin. The technical analysis is simply to delineate the structure of the market.
You can support my work also from my referral links.
Pitacoin is a simple game app with bitcoin prizes. It's 100% free. Let's earn bitcoin starting today.
Use this code and win 1000 satoshi CweWBM
BFast BFree is an app that is only available for Android
Before you start using the app you will be asked for a referral code. Here's mine: 9YE0A7
-----------------------------------------------------------------------------------------------------------------------------------------------------------------
EFast BFree: a mobile app to earn Ethereum for free
Before you start using the app you will be asked for a referral code. Here's mine: RJEB3N
-----------------------------------------------------------------------------------------------------------------
SwissBorg.
Not ready to invest in cryptos yet?
Try our Community App to learn and earn Bitcoin with zero risk.
Use this code T2BK6AQ and win 3000 points. Just predict BTC price goes Up or Down
--------------------------------------------------------------------------------------------------------------------------------
StromPlay.
Make every day payday. With Storm’s apps you can complete quick microtasks to earn Storm, Bitcoin, Ethereum, Litecoin, or Dai. Seriously, it’s that simple. Use this code DYUA1HGL
Cryptomine Game +5% in mining
redbuble.com Crypto t-shirts and more kinds of stuff for you.






