
For more content like this tip me if you can! thank u :)
DOT Analysis
Polkadot is trying to break the EMA500 (23$) resistence but yesterday rejected hard, even with that rejection today could break it if btc break 42k.

FTM Analysis
Fantom is still above EMA 200 wich is good, but rejected EMA99 yesterday wich could mean it would lose EMA200 if btc doesn't go up, but if it does FTM would be very bullish breaking EMA99 and 56 and probably doing a new All TIME HIGH.

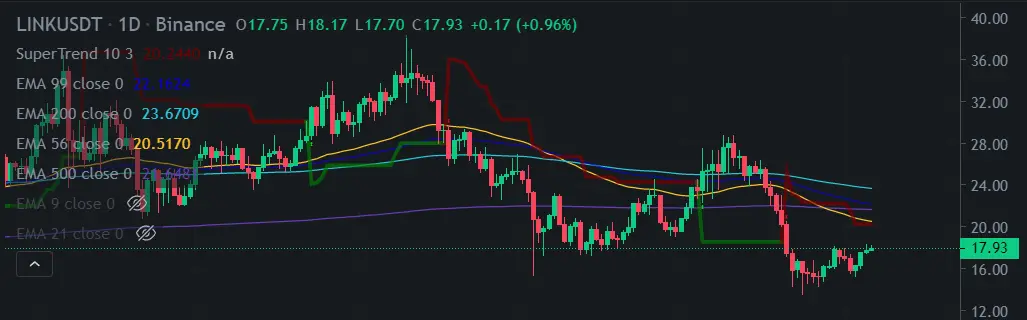
LINK Analysis
It seems like it's the end of the world to LINK but she could still go to 22$ and probably go down again if btc doesn't start another bulltrend from 42k.
Are you a good gamer? Pipeflare is giving 2000$ per month to players who can get the best scores in their games Playing for 15 min, don't lose this opportunity!
Supertrend Indicator Daily and Weekly
_____________________________________________
DOT | Weekly chart | Down Trend |
| Daily chart | Down Trend |
_____________________________________________
FTM | Weekly chart | UP Trend |
| Daily chart | Down Trend |
______________________________________________
LINK | Weekly chart | Down Trend |
| Daily chart | Down Trend |
______________________________________________
RSI Indicator
All below 50, but Dot is trying to break above right now, FTM and LINK are going to wait to see what btc does.
DOT

FTM

LINK
Suports and resistences
_____________________________________________
DOT | Suport -> 15$ and 10$
| Resistence -> 23$ and 30$
______________________________________________
FTM | Suport -> 1.80$
| Resistence -> 2.25$
_____________________________________________
LINK | Suport ->15$
| Resistence -> from 18$ to 20$
______________________________________________
Volume (in the last 7 days)
_____________________________________________
DOT | 9.9M->10.2M Bigger, but still low.
______________________________________________
FTM | 197M->176M Lower.
_____________________________________________
LINK | 8.1M->7.8M Lower.
______________________________________________






