For more content like this tip me if you can! thank u :)
Chart Analysis
Looking at the charts we can clearly see that Bitcoin had a massive downtrend since Nov 2021, going from almost 70K to 17K which was a surprise for some people like me that did not expect bitcoin to break 30K in the summer.
From where I am standing bitcoin had a harsh winter and that could mean bitcoin could have a nice bull market until the end of the year, I don't really think bitcoin will start another BIG Bull Market but I think it will go up until the end of the year.
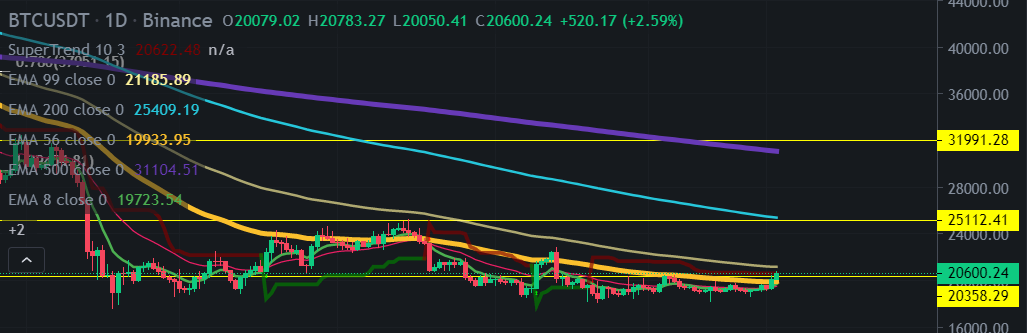
Looking at the chart again, Bitcoin has been holding pretty well at the 19K support, a very important support that is squezzing the price against the EMA56, basically in the next couple of days bitcoin will break EMA56 and turn it into a support or reject the breaking and go to 15K which i don't really think it will happen because every indicator is looking nice for upside, for example:
-
We have been experiencing Big Volumes since September
-
We have been trying to make 50 the support in the RSI