There are solid support signals on Bitcoin price chart. I shared a few analysis about Bitcoin price chart about possible triple bottom pattern. It supported Bitcoin price from 60K-58K USD level. Bitcoin price touched this great support line a few days ago. It was third time to touch.
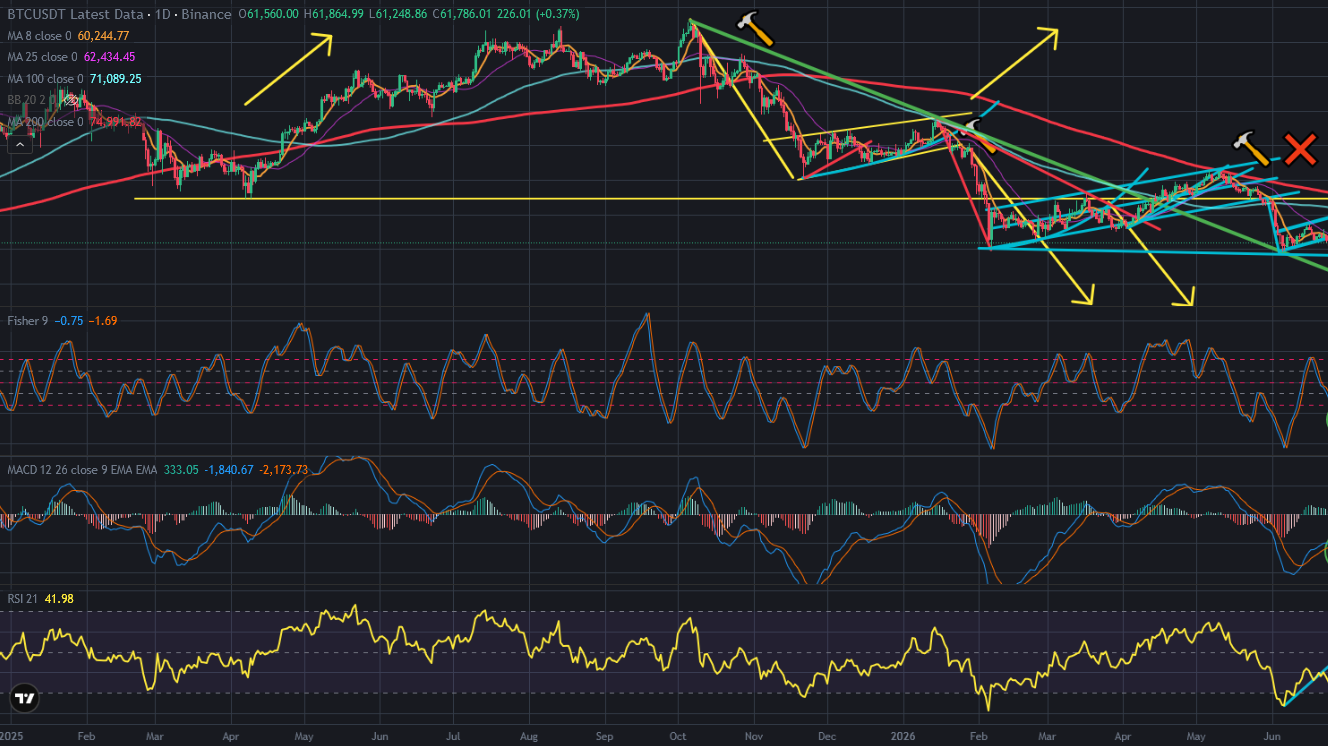
Here you can see daily chart of Bitcoin price. There was great downtrend line coming from all time high. After breaking up this great downtrend line, Bitcoin price went up slowly and reached 80K. After reversing down from 80K USD level, Bitcoin price reversed down and touched again this great downtrend line as retest. After retesting downtrend line as a support, Bitcoin price was in an ascending channel. After breaking down this ascending channel, Bitcoin price touched again 60K-58K USD support level. It was third time.

Here you can see the indicators on daily chart of Bitcoin price. Fisher Indicator reversed up from the bottom. MACD Indicator is trying to reverse up below 0 level.
There was mini uptrend line on RSI Indicator and It is broken down. We need to the new pattern on RSI Indicator.

Even there is no solid signals on the indicators, Bitcoin price is being supported by triple bottom pattern. It should stay above this support line. We should not see breaking down this level. If it supports Bitcoin price, we may see reversing up.


