The CMF indicator which is the short for the Chaikin Money Flow Indicator is basically a technical indicator that measures the volume-weighted average of accumulation and distribution of any cryptocurrency asset over a particular period of time. The CMF indicator has proven to be a very powerful indicator for identifying trends in the market. The CMF indicator was developed in the 1980s by Marc Chaikin with the sole purpose of monitoring and measuring the accumulation and distribution of an asset over a particular period of time. The Chaikin Money Flow Indicator has a default period value of 21.
The CMF indicator oscillator moves between +1 and -1. When the CMF oscillator line moves above 0 or moves below 0, it can strongly indicate that there are changes in the money flow and also the buying momentum and selling momentum. When the CMF oscillator line moves into the positive readings above 0 and remains above 0, it indicates that buying pressure is present in the market and the strength of the uptrend. When the CMF oscillator line moves into the negative readings below 0 and remains below 0, it indicates that selling pressure is present in the market and the strength of the downtrend. Also, When the CMF oscillator line ranges around the 0 center line and moves between -0.05 and 0.05 values, this indicates that there is indecision in the market or decision making period in the market and that the buying pressure and selling pressure are relatively at an equilibrium. This means that there isn’t any clear market direction or trend.
.png)
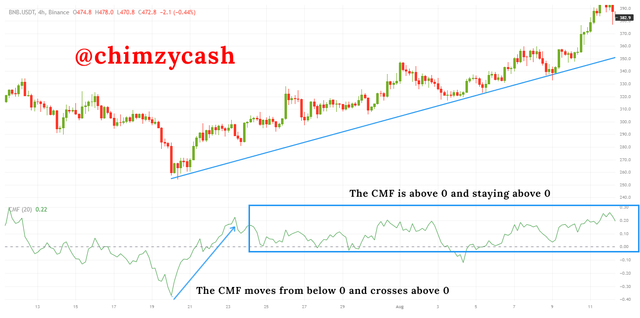
Confirming Uptrend
The CMF is great for confirming the direction of a market trend. When the price is moving in an uptrend direction, the CMF indicator will indicate by the oscillator line also rising in an upward slope and moving above the 0 line. For the trend confirmation, the CMF oscillator line has to remain above the 0 line to confirm that the market is in an uptrend direction and the strength of the uptrend if the oscillator line continues to remain above the 0 line.
When the oscillator line is above 0 and remain above the 0 line, it basically means that there are more buyers in the market and the buying pressure is high which is causing the price to rise. This can be as a result of accumulation in the market. Looking at the BNB/USDT chart, we can see that as the market reversed into an uptrend, the CMF indicator indicated that as the oscillator line crossed above the 0 line and remained above the 0 line to confirm the uptrend.
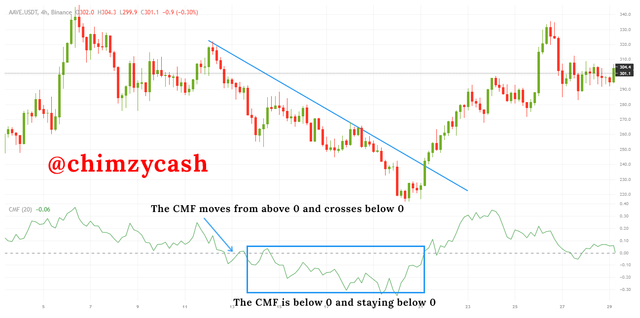
Confirming Downtrend
When the price is moving in a downtrend direction, the CMF indicator will indicate by the oscillator line also falling in a downward slope and moving below the 0 line. For the downtrend confirmation, the CMF oscillator line has to cross below the 0 line and remain below the 0 line to confirm that the market is truly in a downtrend and the strength of the downtrend becomes stronger if the oscillator line continues to remain below the 0 line.
When the oscillator line is below 0 and staying below the 0 line, it basically means that there are more sellers in the market and the selling pressure is high which is causing the price to fall. This can be as a result of distribution in the market. Looking at the AAVE/USDT chart, we can see that as the market reversed into a downtrend, the CMF indicator indicated the downtrend movement as the oscillator line crossed below the 0 line and remained below the 0 line to confirm the downtrend.