
I’ve been studying the on-chain data closely.
And I’ve come to a sobering conclusion.
Is the bottom in?
According to Galaxy Research, the answer is no, not yet.
Let me tell you why.
.
.
What Galaxy Research Found
Galaxy Research put out a report on June 12, 2026, warning that Bitcoin has likely not seen the cycle bottom .
The research firm analyzed on-chain and market data and found that only four of 13 historical indicators that have always shown up at a cycle bottom have so far appeared in the current drawdown.
Below is the clarification of what Galaxy Research means by “bottom not in” versus “bottom is near.”
“Bottom not in” implies that the market has not yet seen the full capitulation process unfold, with most historical cycle-bottom signals still to come.
The strongest signals - price below production cost, holders in aggregate losses, sustained loss-taking, and deep capitulation selling - have not yet appeared.
“Bottom near” implies that the market is approaching historical support levels but still needs more time to fully exhaust the capitulation process to reach a cycle low.
.
.
The 13 Indicators - And Where We Stand
Galaxy’s scorecard covers five categories: valuation, profit-taking, miner dynamics, trend, and sentiment.
Of the 13 indicators that have shown up at every cycle bottom, here’s where we are as of June 9, 2026:
Category Status
Fear sentiment reading ✅ Triggered
Trend gauge near lower range ✅ Triggered
First dip below 200-week moving average ✅ Triggered
Hash Ribbons recovery cross ✅ Triggered
Price below on-chain cost basis ❌ Not yet
Holders in aggregate losses ❌ Not yet
Sustained loss-taking ❌ Not yet
The four indicators that have so far appeared in the current drawdown are the fear sentiment reading, the trend gauge near the lower range, the first dip below the 200-week moving average, and the Hash Ribbons recovery cross.
The last one saw the cross in early June, making it the first miner-related signal this cycle, but Galaxy notes that it came earlier than usual, potentially due to miners re-allocating resources to artificial intelligence.
The strongest signals pointing to a cycle bottom have yet to appear.
Price has not yet dipped below the on-chain cost basis, holders are not sitting in aggregate losses, and there has not been a wave of sustained loss-taking.
These three signals have consistently shown up at every previous bear-market low.
Their absence is a sign that the capitulation process is not yet over.
.
.
Timing Also Supports a Later Bottom
The previous cycles have seen the drawdowns last between 12 and 13 months, with the peak-to-trough period running through roughly the same time as the current one.
As of June 9, 2026, the current correction has been going on for about eight months.
According to Galaxy Research, the window for the bear-market low to appear is set to open later this year.
At roughly the same point in the cycle, 242 days from the peak, the drawdowns in 2017–2018 and 2021–2022 peaked at 68% from the highs.
The current cycle, at 51%, has only recently moved past where the 2013–2015 correction peaked at this point in the cycle, supporting the view that the capitulation has further to run.
.
.
The Calmest Top in History Has Raised the Dollar Floor
The peak in October 2025 was the calmest in Bitcoin history, with the market value to realized value (MVRV) ratio peaking at 2.29.
It was lower than any previous cycle peak, with MVRV ranging between 2.93 and 5.91 in prior cycles.
Only two of the 11 traditional topping indicators showed up, and the Pi Cycle Top signal did not.
As a result, the cost basis - the price at which all coins are effectively bought - was unusually close to the all-time high at 43.7%.
Compared to the previous cycles, it was higher than 34.2%, 21.2%, and 16.9% that were seen in 2017, 2021, and 2013, respectively.
This has created a floor for the price in dollar terms, constraining the potential downside even if the drawdown matched the previous cycles in percentage terms.
.
.
The Price Range
Galaxy Research offers a useful breakdown of potential price ranges for the long-awaited Bitcoin bottom based on the MVRV:
Scenario MVRV Range Price Range
Base case 0.75 – 0.86 $40,000 - $46,000
Harsh washout 0.56 – 0.70 $30,000 - $37,000
Shallow outcome Near 1.0 $51,000 - $54,000
The base-case scenario range of $40,000 and $46,000 is set to come due by the end of 2026, according to Galaxy Research.
However, the firm notes that the cost basis can fall during a significant sell-off as traders lock in losses, with the dynamic dragging the price floor down with it.
A 10% to 30% drop in the cost basis during a panic would push the value of $40,000 back toward $28,000 .
.
.
What Analysts Are Saying
Several analysts have offered their thoughts on when the bottom might come.
Benjamin Cowen’s July 2026 memo estimates the next Bitcoin bottom to be in the fourth quarter of 2026.
His seasonal math suggests a price floor near $44,000, with his framework now officially in the bottom-watch mode.
He wrote: “The framework is in bottom-watch mode, with the low most likely a matter of months rather than weeks away.”
Standard Chartered is more optimistic, with its analysts pricing the Bitcoin bottom at $59,000 and targeting $100,000 by year-end.
10x Research has lowered its bottom estimate from $55,000 to around $50,000, with a possible range of $46,628 to $50,732 .
CryptoQuant has set its sights on $53,600 as a valuation bottom, with the realized price being an important valuation anchor during bear markets.
Bitfinex has $53,400 realized price as important structural support. If demand remains weak, the market could test $40,000 in mind for the fourth quarter, while NYDIG believes this could be the shallowest bear market for Bitcoin, with the current level potentially being the floor.
Their extreme scenario, however, is at $37,900.
.
.
The Current Structure
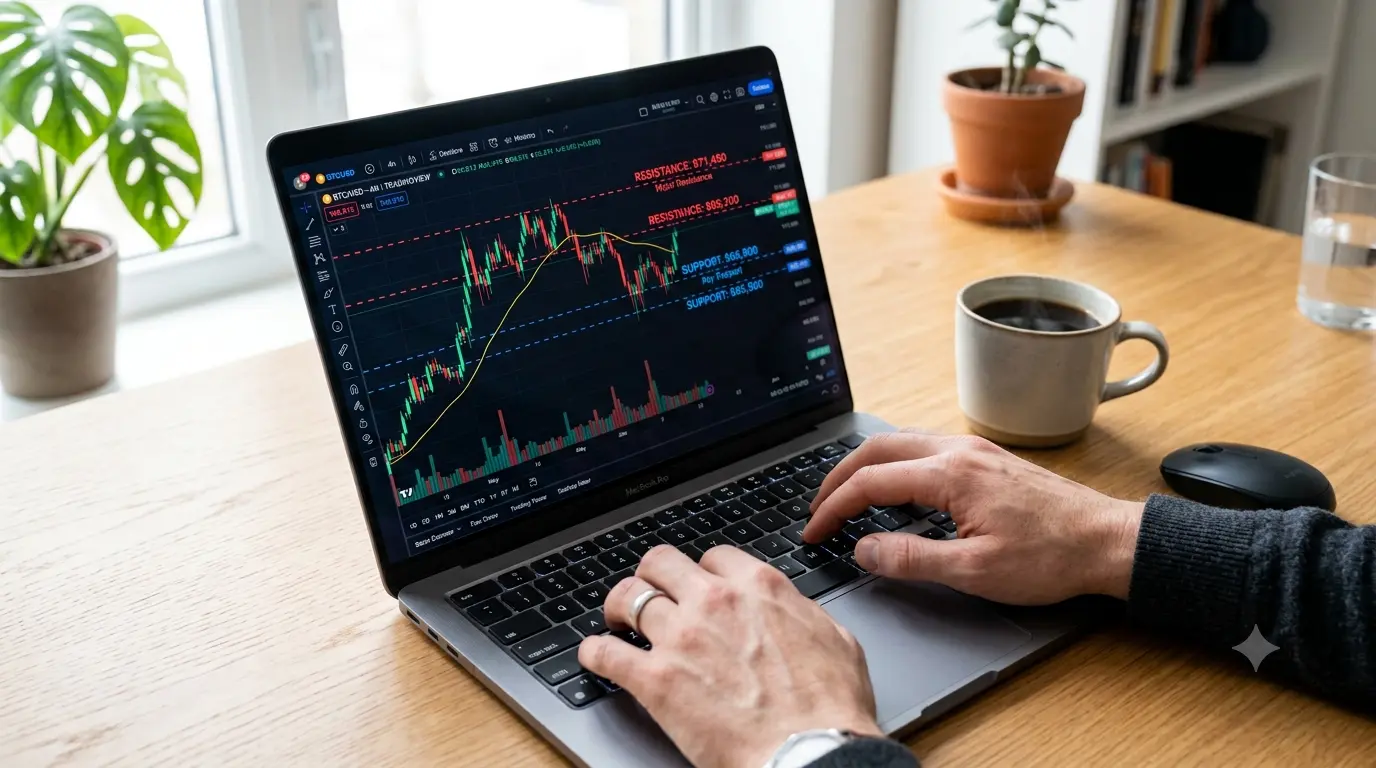
Bitcoin has bounced back from the July lows of $57,800 and now trades around $63,000–$30,000 - $0__65,200–$30,000 - $1__67,000–$69,000 .
Whales accumulated 19,696 BTC worth of $1.25 billion during the down leg over eight days - a period of weakness for the price.
Santiment has noted the contrasting action between retail and whale traders as a positive sign.
The Puell Multiple is just above 0.5, with the long-term holder supply reaching a record 16.75 million BTC on July 11, equal to nearly 84% of the circulating supply.
.
.
What This Means for You
So, where does this leave us?
As mentioned, the data strongly suggests that the bottom is coming - but not yet.
We are in the late stages of the bear market, with the indicators pointing in the right direction, but not yet at the level needed to suggest an imminent bottom.
Galaxy Research’s report suggests that the window for the bottom to appear is set to open later this year, with the base-case scenario pointing to a price floor between $30,000 - $2__46,000 .
For DCA investors, this period when the price is near or below the historical support levels is an excellent opportunity to accumulate more coins.
For traders, the Q4 2026 window is an important one to watch.
.
.
What’s your take on the current market situation? Let’s discuss it in the comments below!






