Ralph Nelson developed the Elliott Wave theory in the mid-1930s.
Elliott believed that stock markets, which are widely believed to be moving randomly and arbitrarily, are behaving according to repetitive behavior.
In this article, we will learn about the history of Elliott theory and how it is applied in trading.
Elliott suggested that trends in financial prices are a result of the prevailing psychological state of investors.
Elliott theory is somewhat similar to the Dow theory in that both recognize that stock prices move in waves.
In addition, Elliott realized that markets move in an iterative manner in nature, and patterns repeat in every time frame, no matter how small.
With this in mind, he began to consider how to use these recurring patterns as predictive indicators of future market movements.
Predicting market movement by taking advantage of Elliott patterns
Elliott made detailed predictions of the stock market based on reliable properties he discovered in the wave patterns.
An impulsive wave: that travels in the same direction of a trend , always appears five waves in its pattern.
Corrective wave: It is heading against the direction of the primary trend, and it is opposite to the direction of the motive wave
Within smaller time scales, another five motive waves can be found within the larger motive waves
That is, this pattern is repeated in a cyclical paralysis within every time frame, no matter how small
We know that in financial markets, “what goes up, must fall,” where an up or down price movement always follows an opposite movement.
Price action is divided into trends and corrections. Trends show the main direction of prices, while corrections move opposite to that trend.
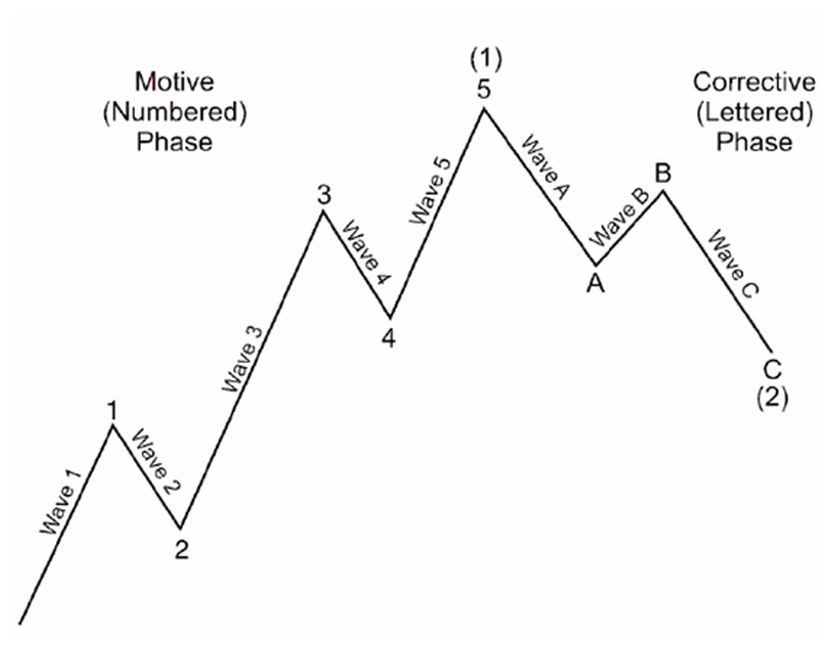 As we note in the image above:
- Five waves are moving with the main trend line, followed by 3 corrective waves
- The basic 5-3 pattern remains constant, although the duration of each wave may vary.
Waves 1, 2, 3, 4 and 5 form an impulse, and waves A, B, and C form a retracement.
The five waves in turn form one impulsive wave on a higher time frame, and the three-wave correction forms wave 2 on the same higher frame.
This stereotype and repetition can be used in making the decision to enter and exit a deal.
It is clear that if we enter at point 2 and exit at point 5 we will have made a profit.
But Elliott waves, like any other indicator, need training and practice and do not succeed in all cases for the simple reason that traders disagree on the interpretation of these waves.
This difference is also reflected in the chart, but as a general advice, always look at the higher timeframe 🙂.