
Once cryptocurrencies gained substantial market capitalization and thanks to the rising interest of institutional investors and banks there were billions of dollars pouring into the space. This led to high demand in technical analysis reports and videos linked to which way the popular coins were expected to move. If you have experience in trading or investing in traditional stocks, forex, commodities etc then you would be quite familiar with most of the TA as the trading principals mostly remain the same irrespective of what instrument is getting traded. It is a debatable topic whether standard TA principles can be applied to crypto as this market is relatively very new and prone to manipulations by sharks but that’s a completely different discussion altogether. In this topic I want to familiarize you with basic TA fundamentals in case you don’t have experience in trading and find yourself confused when you watch a crypto video and there are terms like candlestick, volume, support & resistance thrown at you.
As this is a basics video don’t expect to become a trading expert after reading it and start leverage trading at an exchange near you as the results can be disastrous. I personally traded stocks for over 10 years but when it comes to crypto I prefer to HODL. In any case it doesn’t harm to know the basics so you can get better context next time you read some analysis about which way your favourite crypto is going to move.
1. Candle Stick Chart
A candlestick chart would typically look like a pattern in the image below, which would constitute of a sequence of green and red bars of varying sizes.

Each bar would consist of 2 parts- the body and the wick. Body refers to the solid rectangular portion in the middle and the wick refers to the lines extending at the top and bottom.
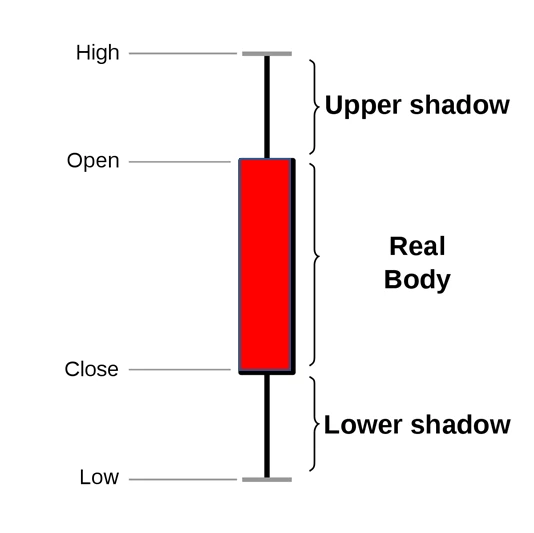
Depending on the time range being considered each candle can represent a day, week or month and some people even use it at an hourly level. If the bar is green it means during the selected period the market closed at a higher level than the opening level and a red candle signifies the reverse.
For example in the red candle in image above the High represents the maximum value the coin touched in the period and the Low means the lowest price it sunk to in that time range.
A candlestick chart is considered much more useful than a chart with just a simple line, as with candle you can see more details about the fluctuation levels within each period.
2. Moving Averages (MA)
Next key principle is moving averages which is important to understand when a price chart might move it’s direction. There are several types of MA of which 20, 50, 100, 200 are more popular. 50 MA means if the chart is using one candle equal to one day then the 50 MA would mean what is the average price during the last 50 days. The bigger is the scale the slower will be the movement so 200 MA will move slowly compared to 50 MA.

The chart above shows candlestick pattern against 20 MA and 100 MA. There is a price movement expected once the price falls below the MA support line or 2 of the major MA lines cross over. When the chart seems to keep bouncing over the MA then this line is considered a support level and if the pattern struggle to rise above it then it is considered a resistance level.
3. Volumes
Many analysts use the candlestick pattern together with the volume data as they use the correlation to confirm their predictions. Example rising volume with rising price gives more strength to the bull run and a price rise with falling volumes means the price might crash soon.

TA is a very vast field and these are just some of the fundamental principles, but I feel these are the basics you need to understand clearly before you start getting involved more deeply. For beginners one good approach is open a dummy account with an exchange to practice your predictions on the movements with dummy money and once you feel confident you can start with small amounts of real money. Many popular sites like eToro provide the option for creating a dummy trading account.
Cheers,
SamBTC
_________________________________________________________________
If you liked this article and would be interested in more articles related to cryptocurrencies do give my accounts in Uptrennd and Publish0x a visit.
Uptrennd Referral link- https://www.uptrennd.com/signup/MzI4OTI
Publish0x Referral link- https://www.publish0x.com?a=zPdyJz7eQr
Originally posted on Uptrennd by me at - https://www.uptrennd.com/post-detail/technical-analysis-ta-101-the-basics~MjEwNzEz#postMjYwNjQ3






