
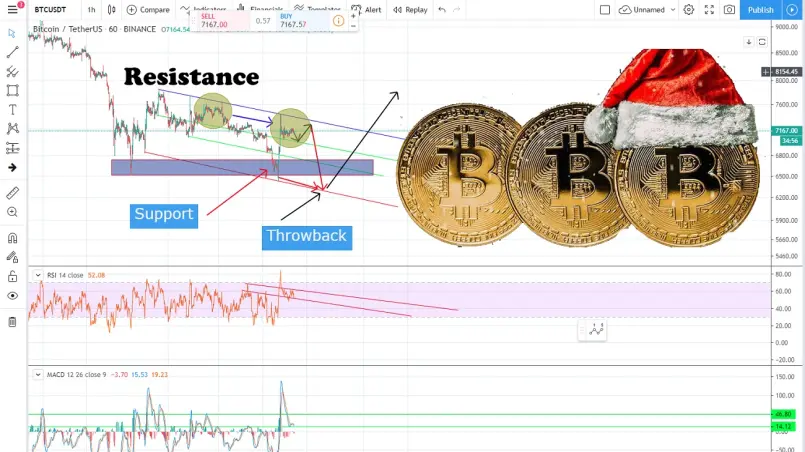
Charting BTC/USDT
There are bullish and bearish scenarios on the said graph. The black arrow below and above stands for throwback and expecting some uptrend in this area. Now our target must break the red line above the $ 7.5k to $7.6k if not then it will go below between the green trend line we call this as "no trade zone or the decision area" (But we assume the there's a bounce-back on the said price if not then it will continue to fall) and would be the accumulation area for few days. Now the blue arrow can create a new head and shoulders graph. The rectangle our strong support line as well the red line below. We use the RSI 14 close to determine if this is safe to trade or not but as you can see, still in the decision area. The below would be the MACD 12 26 close 9 shows the same a decision area but there's a strong possibility to downtrend. On this day the highest price of BTC is $7190.58 and the lowest is $7154.14.
Stay tuned for more updates, Next week is holiday season and I guess that there are lots of traders doing some vacation? or maybe they will do trades or spending time with their loved ones? Who knows?
Thank you! God Bless and Happy Holiday Cheers!






