
Greetings! In this article, I will go over my technical analysis I did today and explain what indicators were notable and future potential scenarios of the Ethereum price action.
Slow bleed for Ethereum and all altcoins?
During the past couple of days, Ethereum, along with many top altcoins have been slowly losing value over Bitcoin (Despite Bitcoin consolidating). While this may seem temporary, a further look into the Ethereum technical indicators proves otherwise.
4-hour time frame:
In the 4-hour time frame, the RSI is still within neutral territories. However, the MACD is nearly at a bearish cross, which means that within the next few days, we can see either a small move towards the 1.6k support level or a large move towards the downside to the 1.55k support level (Which is very unlikely due to the neutral RSI). At the same time, if Ethereum is to move down to the 1.6k support level, there would likely be some kind of reaction due to most likely pushing the RSI into oversold territories. Overall, these indicators combined does indicate that while Ethereum is likely to dump towards the 1.6k support level, it will also reset the RSI and have some kind of reaction (Depending on what is on the daily timeframe, there may or may not be a reaction on the 1.6k level).
24-hour time frame:
In the 24-hour time frame, the RSI is still within neutral territories, however, the MACD is currently nearly at a bearish cross (Which indicates a move towards the downside is soon to come within the next week). Additionally, within the last few days, Ethereum was rejected from the 20 EMA resistance level (as expected) and is on its way down to potentially make a lower low. Furthermore, Ethereum is currently within a descending channel, which along with the fact that it was rejected from the 20 EMA resistance level and the bearish cross on the MACD, it is very likely that Ethereum will hit at the very minimum 1.55k (And max, 1.52k) within the next week.
Weekly time frame:
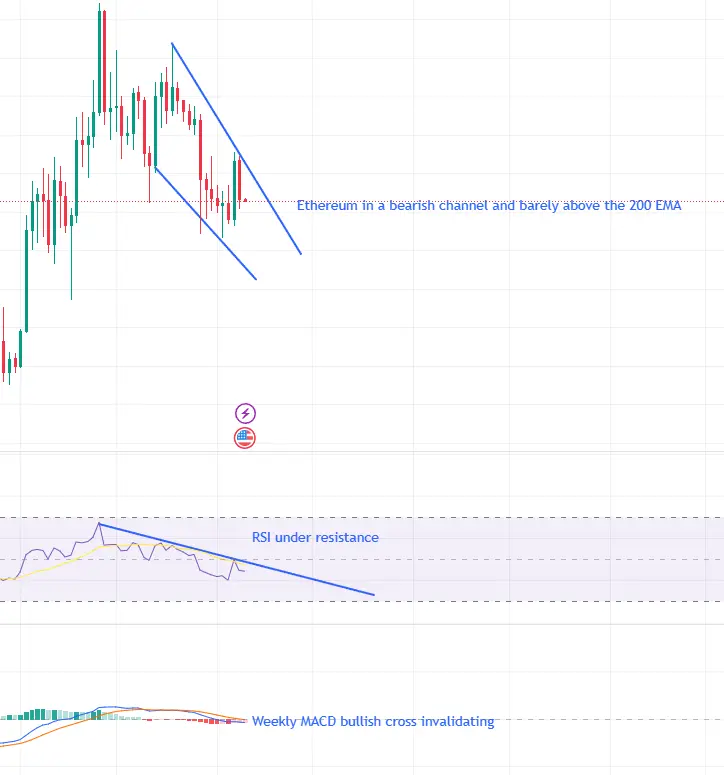
In the weekly time frame, the RSI is still within the RSI resistance level and the bullish cross that was forming on the MACD is breaking apart. Additionally, Ethereum is still under the 20 and 50 EMAs and barely above the 200 EMA support level. However, given the situation with the RSI and MACD on the weekly time frame, it is likely that Ethereum might go below the 200 EMA within the next few weeks (Very slowly due to the RSI still being in neutral territories). The bearish channel as a whole is likely to end at either the 1.5k or 1.45k support levels before some kind of reaction (The RSI will most likely reach near oversold territories and the MACD will gradually curve up over time).
Conclusion
In conclusion, Ethereum, along with many altcoins, is likely to begin slowly bleeding over the course of the next few weeks (Not a fast crash towards lower targets) similar to the slow bleed with Bitcoin from 30k previously. However, Ethereum will most likely find a reversal point at the 1.5k - 1.45k levels after the slow bleed is over.





