
Greetings! In this article, I will go over my technical analysis I did today and explain what indicators were notable and future potential scenarios of the Ethereum price action.
Ethereum Underperforming Bitcoin?
During the past couple of days, the crypto market as a whole, not just Ethereum, was going down a rapid downward trajectory. However, Ethereum, along with the rest of the altcoins have been underperforming Bitcoin during this (Bitcoin dumped only 2% while Ethereum dumped 6%). Today, using technical analysis, I will be talking about the potential effects of Ethereum underperforming Bitcoin.
4-hour time frame:
In the 4-hour time frame, the RSI is still touching oversold territories and the MACD is forming a bullish cross. This can be seen as very optimistic for the Ethereum price within the next couple of days or so. However, Ethereum is still under the 20 EMA resistance, of which is currently in a bearish channel under the 50 EMA. Due to this, the max Ethereum can realistically go is the 1.59k resistance level before continuing a downtrend (To potentially lower price levels).
24-hour time frame:
In the 24-hour time frame, the RSI, by now, well under RSI resistance and the MACD is just feeling the effects of a bearish cross that was just recently confirmed. These indicators are extremely bearish and it means that Ethereum will most likely continue to descend along the descending channel it is currently in. Furthermore, Ethereum is under all of the EMA support regions, meaning that the next region of support is at 1.5k and 1.48k in the future. Unless, as I said in numerous articles, Ethereum gets significant bullish momentum (Which will someday happen) it will continue going down the descending channel and by doing so, hitting even lower and lower price targets.
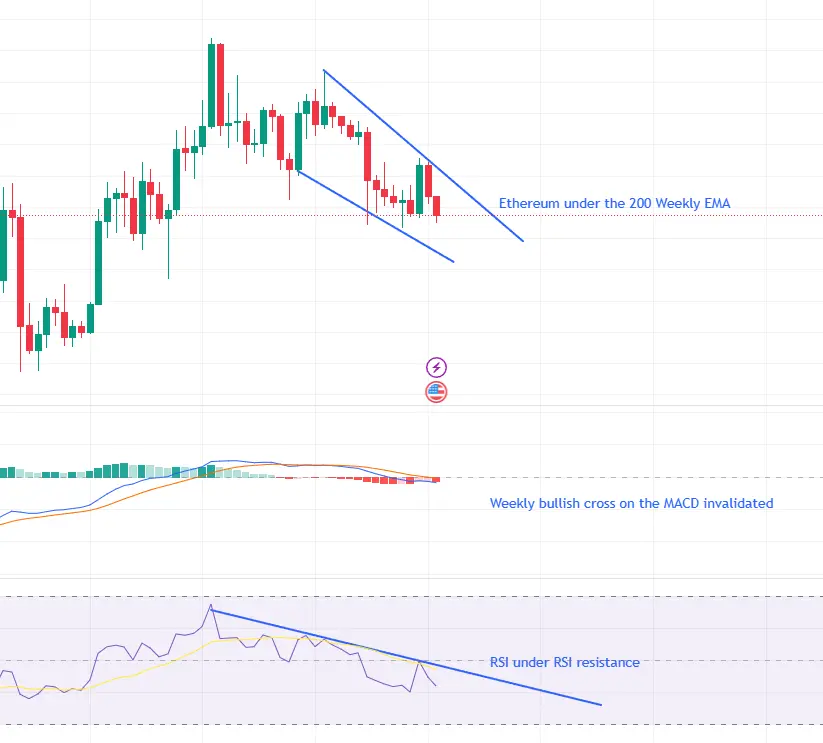
Weekly time frame:
In the weekly time frame, the RSI is now back under RSI resistance (As shown on the daily time frame) and the bullish cross that was once nearly formed on the MACD has completely disappeared and is replaced by a strong bearish bar. Additionally, Ethereum has now broken through the final EMA support region (Which was the 200 EMA). All these indicators mean that Ethereum will most likely continue to descend further down the descending channel for the next couple of weeks or so.
Conclusion
In conclusion, Ethereum is looking very bearish with a very high likelihood of a slow bleed to perhaps even 1.35k regions (if macroeconomic factors do get worse) unless more bullish momentum gets added. Especially since Ethereum is underperforming Bitcoin at the moment (And Bitcoin dominance going up right now) it is likely that Ethereum, and the altcoins as a whole, will have a bear season during the next few weeks or months.





