
Greetings! In this article I will go over my technical analysis and the historical trends to determine the next potential moves in price action.
Technical Analysis:
As I said in my last few posts, I believe Bitcoin hitting 24k in September or October is very likely due to the technical analysis I did. Currently, the low volatility in the market could potentially form a daily doji candle, which would indicate a volatile move is soon to come.
However, utilizing my custom-made 20/50 ema difference indicator (A indicator I made that plots the difference between the 20 and 50 ema in a given time) it shows that the 20 EMA could be looking for a rise above the 50 EMA within the next two-three weeks, thus ending this current bearish move. This new indication means that Bitcoin hitting 24k is unlikely during this current bearish move. Currently, I predict that a reversal will begin around in the end of September. Whether the reversal would lead into a bull market is still unknown and is determined by the BTC ETF decision.
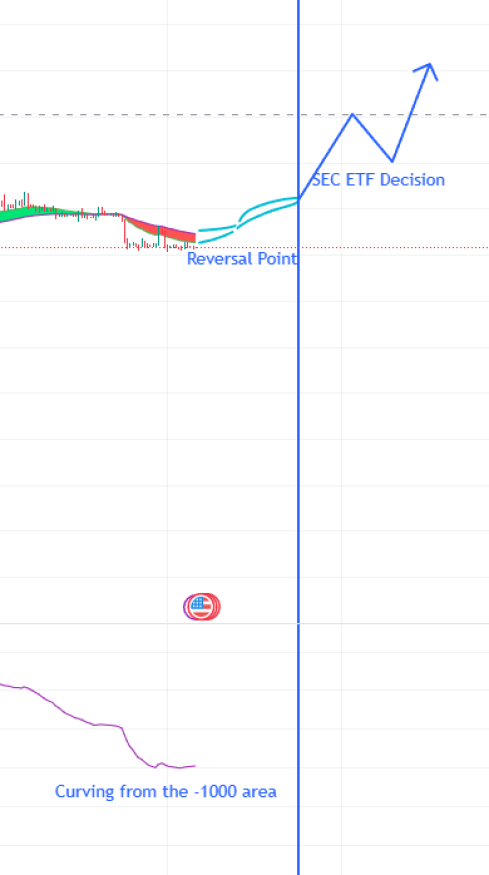
I would not be completely certain of a sideways range between 25k before the reversal in late September and we could expect brief targets lower than 25k. Afterwards, during the early-middle days of October, I predict that we will hit 29-30k once again. Then, seeing how the SEC is currently being backed into a wall in terms of the ETF decision, it is more likely than not that they will approve the ETF and we will see a large jump in price action.
I would say that there is a 70% chance that at the end November, we could see higher price targets.


