
Greetings! In this article, I will go over my technical analysis I did today and explain what indicators were notable and future potential scenarios of the BTC price action.
Effects of today's dump?
Today, Bitcoin, along with many altcoins had a slight dump (Which was large for altcoins and small for Bitcoin) towards the 27.5k levels. However, due to outlining technical factors beforehand, I believe that today's dump will have further technical implications (Of which I will get into now).
4-hour time frame:
In the 4-hour time frame, the MACD is currently showing strong red bars (Which was a continuation of lighter red bars beforehand) and the RSI was also reset towards neutral territories. These two indicators, however, does not indicate anything, other than the fact that there is a likely chance of a small pump within the next day or so.
24-hour time frame:
In the daily time frame, while the RSI did drop a bit, it is still hanging near the overbought territories. Additionally, the MACD is forming a bearish cross at the moment as well. While this may seem bearish, Bitcoin did manage to find support above the EMA support levels. However, despite Bitcoin finding support along the 20, 50, and 200 EMA support levels and the 20 EMA being over the 50 EMA, the bearish cross on the MACD could force Bitcoin back below the EMA levels. Furthermore, the bearish cross could also force the 20 EMA back below the 50 EMA. If this happens, it will mean that Bitcoin would seek targets as low as 24k or even 23k (If external factors push it lower).
Weekly time frame:
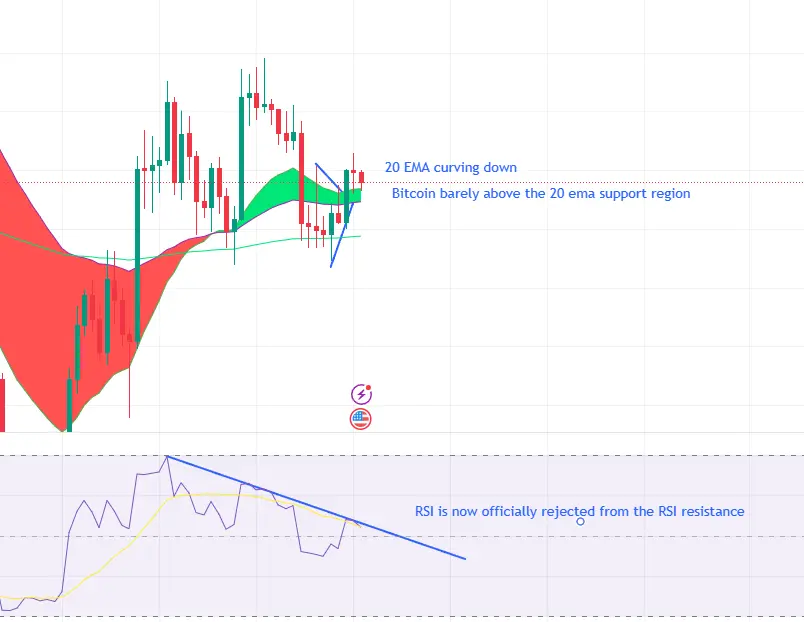
In the weekly time frame, the RSI officially had a rejection from the RSI resistance, which would indicate lower targets are soon to come, however, the MACD is still on trajectory to forming a bullish cross within the next few weeks or so. Additionally, Bitcoin managed to hold support along the 20 EMA (Which is still above the 50 EMA). Unfortunately, however, the 20 EMA has begun to curve down, which could indicate that within the next few weeks, the 20 EMA could be lower than the 50 EMA. If this happens, Bitcoin would most likely dump towards 22-23k levels whilst ignoring the 200 EMA support region. Furthermore, since this dump happened right after a weekly doji candle (Which indicates a volatile move in either direction), Bitcoin is even more likely to break below the EMA support regions and seek lower price targets.
Conclusion:
In conclusion, Bitcoin is set to have a bearish season within the next few months due to the strong RSI resistance and the weekly 20 EMA curving downwards. Without any bullish catalysts to break Bitcoin out of the many resistance levels it is currently in (Both in RSI and EMA levels), Bitcoin will continue to trend downwards in a slow pace.





