
Greetings! In this article, I will go over my technical analysis I did today and explain what indicators were notable and future potential scenarios of the BTC price action.
Uptrend Confirmed?
During the past couple of days, Bitcoin has been on a solid bullish divergence (an uptrend) with confirmed higher lows and higher highs. The technical indicators, however, provides much credibility to the bullish divergence, of which, I will get into now in the 4-hour, 24-hour, and weekly timeframes.
4-hour time frame:
In the four-hour time frame, the MACD has nearly confirmed a bearish cross. Furthermore, the RSI is still in somewhat near overbought territories (being at 60), which means that the bearish cross on the MACD does indicate that the RSI is going to possibly have a reset to oversold territories within the next couple of days. If this were to happen, Bitcoin would go to the next level of support is the 26.9k-27.1k levels. While this may seem somewhat bearish, it would provide Bitcoin with the opportunity to rally towards higher price targets in the future (as shown in the 24-hour timeframe).
24-hour time frame:
The 24-hour time frame's MACD isn't really interesting, other than the fact that the bars still flash green, however it is not in the danger of forming any bearish cross any time soon. The RSI is still somewhatconcerning, with it being very close to overbought territories. However, given the possibility of a small dump (as seen in the four-hour time frame), this could reset the RSI back into neutral territories, and give Bitcoin the opportunity to re-rally towards higher price targets. Bitcoin also managed to find support on the 20, 50, and 200 EMAs with the 20 EMA officially over the 50 EMA (Which is relatively very bullish). However, at the same time, Bitcoin did confirm a lower high in the overall trend. This means that Bitcoin is still within a wedge pattern and is yet to move volatile in either direction.
Weekly time frame:
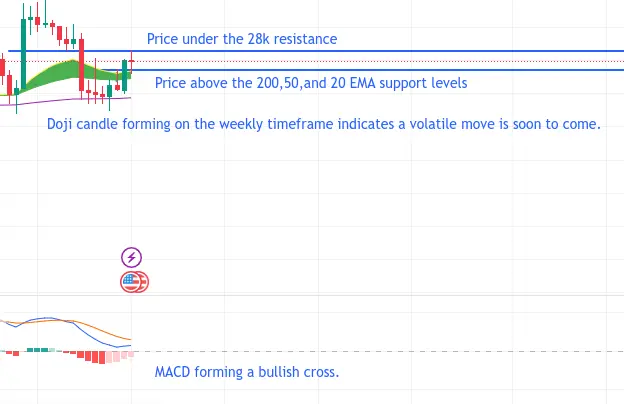
In the weekly time frame, the current candle resembles a doji candle. This means that the next move will be an extremely volatile move in either direction (As supported in the daily timeframe). When it comes to support levels, Bitcoin is sitting above the 200, 50, and 20 EMAs, which means that if a volatile move to the downside is to occur, Bitcoin can find support most likely in the 50 and 200 EMAs. The RSI, however, looks somewhat bearish, with the RSI still within RSI resistance (Meaning that for a break to occur, Bitcoin needs a volatile move towards the upside). The MACD, however, does indicate that the next volatile move will be one to the upside due to nearly forming a bullish cross.
Conclusion:
In conclusion, Bitcoin is currently being built up for a volatile move in either direction due to the indicators on the daily and weekly timeframes. However, the weekly MACD's formation of a bullish cross does indicate that perhaps, the next volatile move will be to the upside. If this is to happen, Bitcoin will be able to break through the current RSI resistance on the weekly timeframe and as well as break through the 28k resistance that it is currently under.





