
Greetings! In this article, I will go over my technical analysis I did today and explain what indicators were notable and future potential scenarios of the BTC price action.
Rally towards 30K soon?
Today, Bitcoin has a small rally from the lower levels of 27k towards the higher levels of 27k. While this wasn't any crazy price action by any means, there are some notable technical indicators to mention.
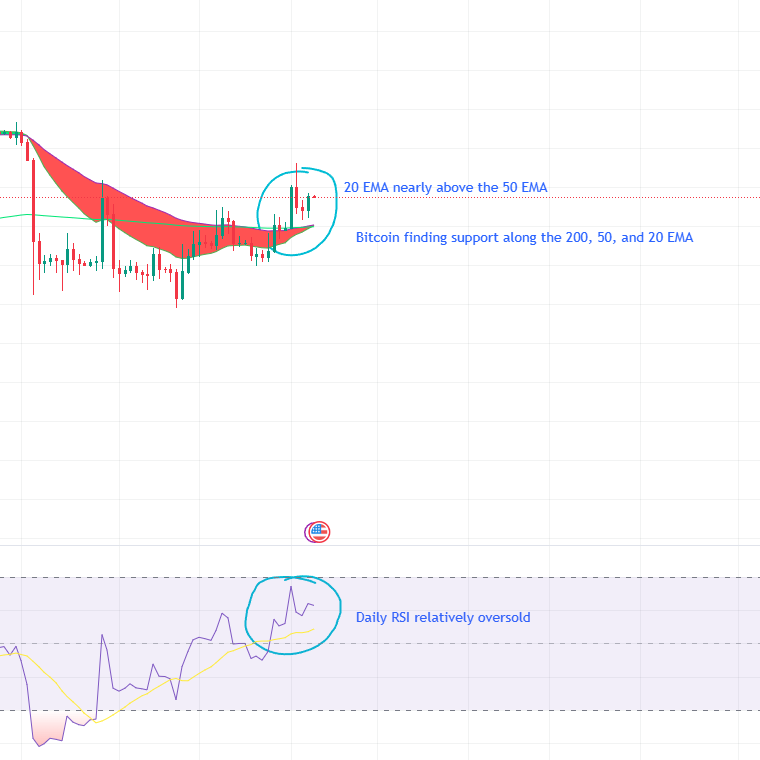
When it comes to the daily EMAs, Bitcoin has been very bullish in that sense. During this rally, Bitcoin managed to find support and retest the 200 and 50 EMA support levels. This means that most likely, Bitcoin has found higher support, which means a higher high. Furthermore, the 20 EMA is now clipping the 50 EMA, which means that by even tomorrow, we can expect to see some kind of reaction. The same can be said for the weekly EMAs, as Bitcoin managed to find support on the highest EMA, the 20 EMA, which means that the next level of resistance will be 29k.
In the weekly timeframe, the MACD is still looking like its nearly about to curve, which is bullish. However, the RSI is still under resistance. This means that until this resistance is broken, the rally will be considered bearish. Furthermore, in the daily timeframe, the RSI is still relatively oversold, which means that at this point, Bitcoin needs a catalyst to be able to break towards oversold territories.
Conclusion
In conclusion, while Bitcoin is looking bullish, with it confirming a higher high and it breaking through key EMA resistance levels in both the daily and weekly timeframes respectively, it still requires a stronger catalyst to be able to break through the weekly RSI resistance and to carry the daily RSI to oversold territories (Which will make Bitcoin go to 29-30k levels).
* DISCLAIMER *
* THIS IS NOT FINANCIAL ADVICE. PLEASE DO YOUR OWN RESEARCH BEFORE INVESTING IN THESE CRYPTOCURRENCIES. THIS IS TO SIMPLY INFORM YOU ABOUT TECHNICAL INDICATORS. *


