
Greetings! In this article, I will go over my technical analysis I did today and explain what indicators were notable and future potential scenarios of the BTC price action.
Sideways price action or further dumpage?
During the past couple of days, Bitcoin has been staying around the 34.5k range for the past couple of days. However, the rally towards the 35k price regions also left Bitcoin's indicators in an unhealthy spot. I mentioned in my previous article about Bitcoin that there will be a strong retracement to around 30k, but in this article, I will be explaining how Bitcoin is likely to rather go into a sideways trading range until further notice.
4-hour time frame:
Currently in the 4-hour time frame, the RSI is back within neutral territories along with the MACD also at neutral territories along with the RSI. This can be seen as relatively bullish because this means that within the next day or two, Bitcoin is likely to hold up the 34k regions. However, in the 24-hour time frame, it indicates a strong correction is soon to come.
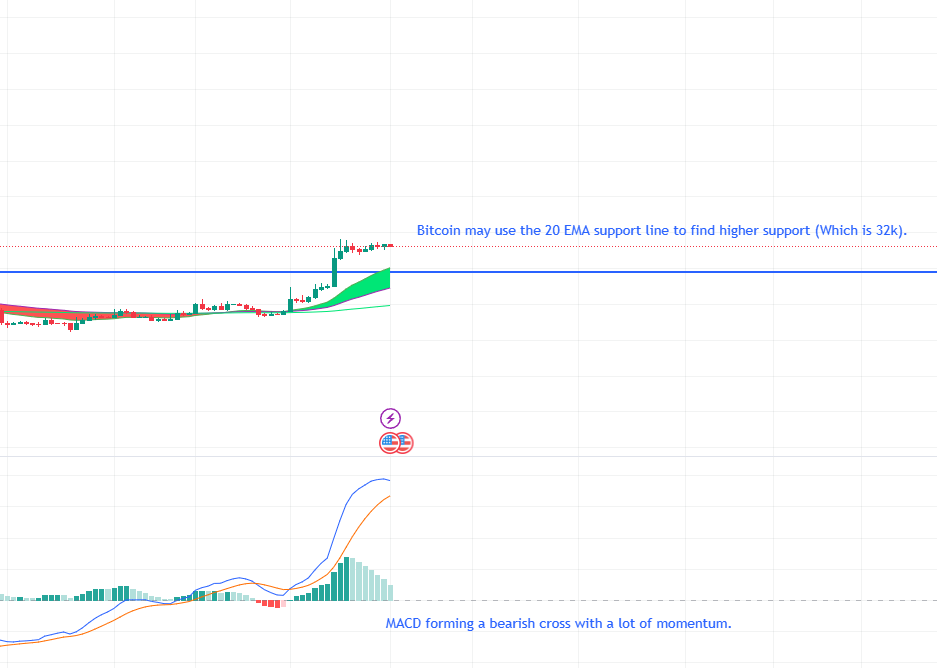
24-hour time frame:
In the 24-hour time frame, the RSI is still well-within overbought territories and the MACD is currently also overbought and forming a bearish cross. This means that within the next week, it is likely that Bitcoin experiences a large initial correction to the 32k levels (Which is the daily 20 EMA support region). However, due to the sheer momentum of the MACD right now, if it were to form a bearish cross, it is possible that Bitcoin does retest 30k again. Overall, the daily time frame is still bearish due to the MACD forming a bearish cross at moment.
Weekly time frame:
In the weekly time frame, Bitcoin does show something similar to the 24-hour time frame. The RSI is being rejected after touching overbought territories. The MACD, however, is still printing strong green bars due to its formation of a bullish cross a few weeks ago. However, due to the daily time frame, it is likely that the MACD will either stay neutral (printing both light green or red bars) or suppress the green bars being printed at the moment (Which means that price will go sideways). This could help reset the overbought levels of the RSI and MACD on all time frames and allow Bitcoin to stay above the 30k support level.
Conclusion:
In conclusion, it is likely that Bitcoin will stay above the 30k support level and form a triangle pattern (Which is a sideways range) and reset the overbought indicators before continuing to rally towards higher price targets (If no big macroeconomic factor plays in).


