
Greetings! In this article, I will go over my technical analysis I did today and explain what indicators were notable and future potential scenarios of the BTC price action.
What's next after today's pump?
Today, Bitcoin had a large pump towards the 28k levels. This was not very surprising for me, especially since I have been talking about it for the past couple of articles. The next thing that we need to figure out now is HOW FAR this rally will go.
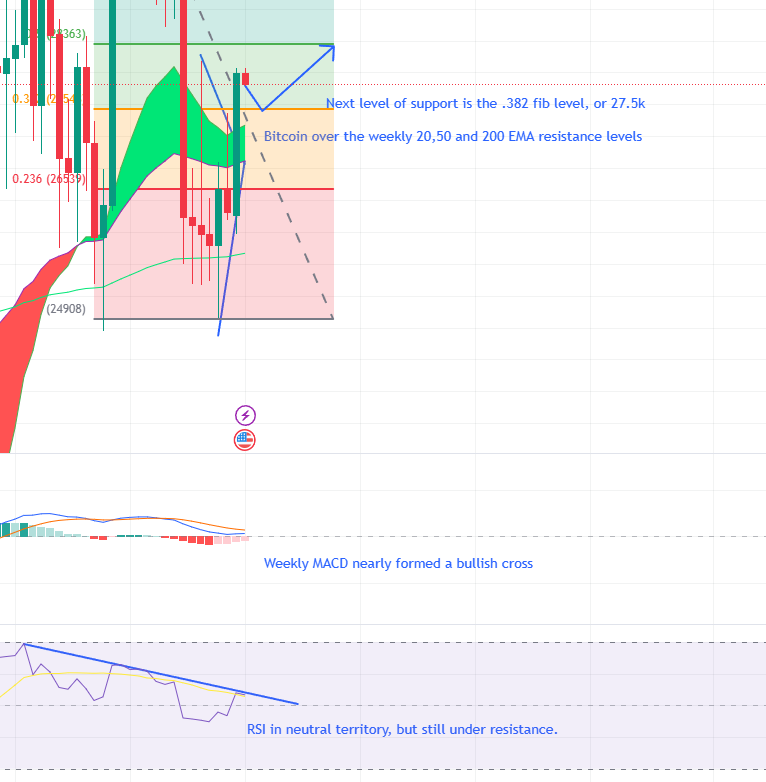
In terms of the weekly timeframe, Bitcoin crossed over the 50 and 20 EMA, which means that with those two crucial support levels reclaimed, we can expect higher price targets. The daily timeframe EMAs look even more bullish, with Bitcoin crossing over all EMA resistance levels. Additionally, the 20 EMA is now almost meeting the 50 EMA, which indicates the end of a bearish downside trend.
However, in the daily, especially 4 hour time frames, the RSI is beginning to go to oversold territories, with the daily RSI being just below and the 4 hour time frame being well-above. Due to this, Bitcoin is likely to have a correction towards 27.5k support level (Due to it being the .382 support level in the fib chart) in order to cool off both RSI. The MACD on the weekly time frame has nearly complemented the formation of a bullish cross. Unfortunately, the weekly RSI is still under resistance, which means that Bitcoin needs more bullish momentum to be able to continue an uptrend towards the 30K levels.
Conclusion
Overall, Bitcoin is looking very bullish in terms of the overall macro trend. The only concerning factor is that the weekly RSI is still under resistance, of which, however, can be easily overcome with stronger bullish momentum. However, in terms of shorter term trends, I see Bitcoin going to 27.5k due to the need to recover from the over-bought RSI and MACD present in the 4 hour and daily timeframes.


