
Crypto trading is a natural attraction for traders and investors from around the world. One commonly used technical analysis tool in crypto trading is the moving average trend line, particularly when it gets crossed over by a second 25 or 50 day moving average. With these two, traders can identify potential entry and exit points for short-term profits and value protection.
Understanding Moving Averages
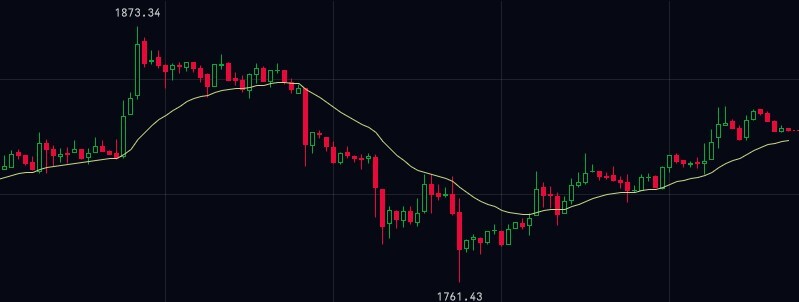
Moving averages are statistical indicators that calculate the average price of an asset over a specific period. They smooth out price fluctuations and help identify the underlying trend. In crypto trading, two commonly used moving averages are the simple moving average (SMA) and the exponential moving average (EMA). But don't get too caught up in the names. Just understand that by applying some basic math, the trend line shows what the average of trades are representing in terms of the overall market direction. In the example below, we see a basic moving average trend line as the yellow line versus the rising green candles and red falling candles reflecting volume and price change for ETH.
Selecting the Appropriate Moving Average
Now here is where things get interesting. The choice of moving average depends on your trading strategy and the timeframe you wish to analyze. Short-term traders often use smaller periods (e.g., 20 or 50 days) to capture more immediate price movements, while long-term traders may prefer larger periods (e.g., 100 or 200) to identify broader trends.
To apply a moving average trend line, you need access to a charting platform that supports technical analysis tools. Many popular cryptocurrency exchanges offer built-in charting features or integrate with third-party platforms like TradingView. Once you have a chart open, locate the indicators or overlays section and select the desired moving average type.
What you want to look for is moving average crossovers. Moving average crossovers are a common technique used to identify potential entry or exit points. When a shorter-term moving average (e.g., 20-period) crosses above a longer-term moving average (e.g., 50-period), it generates a bullish signal. Conversely, when the shorter-term moving average crosses below the longer-term moving average, it produces a bearish signal.
Looking at the same time period as above we get:
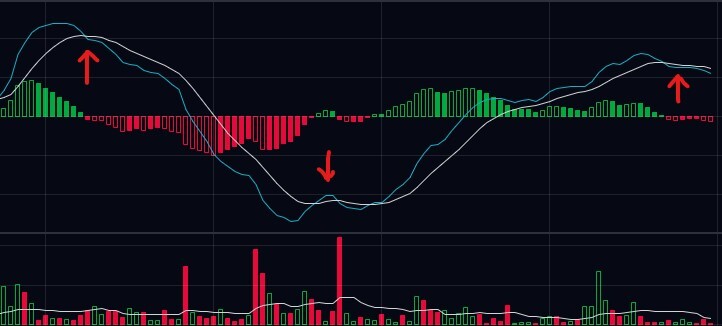
As you can see the chart shows blue line (shorter time window) and a yellow line (longer time window). When these cross, traders view them as potential times to buy and sell. On the left first arrow, the ETH market has topped, sellers are moving out and taking gains. The trend goes down until finally it bottoms out. The second crossover now triggers an interesting extended time to buy. Traders panicked a bit here with a big drop in volume, but those who took the dip as a time to buy, scored very well. By the time they get to the third arrow forming, that crossover sell point made them a lot of profit. This happened over about 2-3 days this week.
Considering Confirmation Signals
While moving average crossovers can provide valuable insights, it's important to consider additional confirmation signals before making trading decisions. Applying moving averages alone don't guarantee profitable trades. So it's crucial to do your own research (DYOR). Determine your risk tolerance, set appropriate stop-loss orders, and consider position sizing to protect your capital and minimize potential losses. Blah blah blah. In short, be willing to lose what you trade and don't whine when the market twists unpredictably on you. This is what risk is all about.
Periodically Reviewing and Adjusting Moving Averages
Markets also evolve, and trends change over time. So don't get hung up on one pattern. Periodically review your chosen moving averages to ensure they remain relevant and effective. Adjust the parameters if needed to adapt to current market conditions and align with your trading goals.
Moving averages are valuable tools for identifying trends and making informed trading decisions in the volatile world of crypto trading, but they are not perfect. Remember to combine moving averages with other indicators, implement risk management strategies, and stay updated with market conditions.


